Saved results:
Loading saved scores and pictures...
Six saved scores
Internal test, diagnostic results and ideal upper bound
The six original scores and their explanations are preserved below. Green labels identify recorded internal results, amber labels identify diagnostic research, and blue labels identify an ideal upper bound. A confirmed label does not mean independent or official verification.
- State accuracy
- The benchmark score combines box overlap when the drone is present with correct absence predictions. It is not simply the percentage of drones detected.
- IoU (intersection over union)
- How much a predicted box overlaps the labelled box, from 0 (no overlap) to 1 (a perfect match).
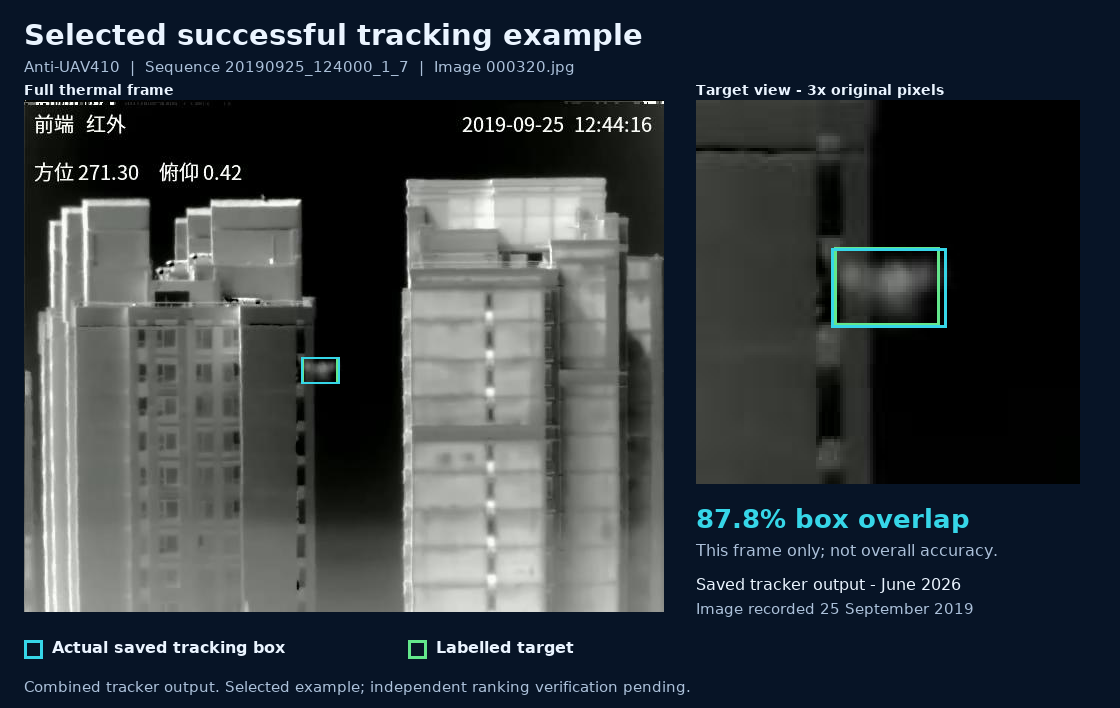
Selected successful tracking example
A faint drone between buildings
Sequence 20190925_124000_1_7, frame 000320. Cyan is the actual saved champion prediction; green is the labelled target. The enlarged view shows the same original camera pixels.
The boxes overlap by 87.8% in this selected frame only. This is not overall tracking accuracy, independent validation or evidence of a world ranking. The champion combines baseline and gap-filled predictions with a validation-selected router; this is not a standalone TUNet result.
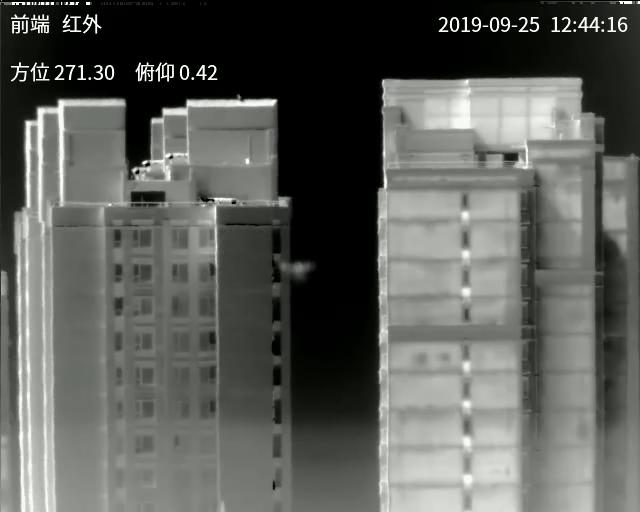
Open the unmodified original camera frame · Inspect the saved box coordinates and overlap calculation
Six selected examples
Selected failure comparisons and diagnostic corrections
Green is ground truth (the labelled answer), red is the saved clean champion, and cyan is the diagnostic TUNet/Viterbi correction. Each picture includes the full scene and an enlarged target region.
The saved clean tracker misses the target in these six selected frames. The cyan diagnostic correction uses known test answers. These are the three largest diagnostic improvements from each of two sequences, not a representative sample of all test frames.
Recorded method
How these research results were produced
TUNet proposes candidate boxes. Geometry expansion adds nearby boxes; source balancing combines candidates; Viterbi selects a path of boxes over time. The clean champion combines baseline and gap-filled predictions using a validation-selected router. The six scores are not all results from a standalone TUNet model.
Evidence and limits
How to read these results
Claim labels
- Confirmed internal result
- A recorded internal score checked against saved reports. This is not independent validation or a new evaluation.
- Diagnostic
- Research that may use known internal test labels for analysis or patch choice. The diagnostic patches shown here used those labels to choose sequence replacements; they are not clean hidden-test results.
- Oracle
- An ideal selection ceiling: whether candidate boxes contain useful answers. It is not achieved tracking performance.
Public data and limitations
All six displayed scores match the surviving internal score reports, to the precision shown. Some supporting candidate files are unavailable in the current archive, so full reproduction has not been established.
- Saved scores, method and picture data
- Evidence notes and claim policy
- Official Anti-UAV410 benchmark and evaluation code. The benchmark source describes the test; it does not verify KYAMOS results.
- Read the separate company-reported ranking claim and its limits. This June snapshot does not establish that claim.