01COLD WATER
Cool and absorb
Cold water carries away the heat of absorption. Hydrogen enters the open pore space and is taken into the metal-hydride alloy at lower pressure.
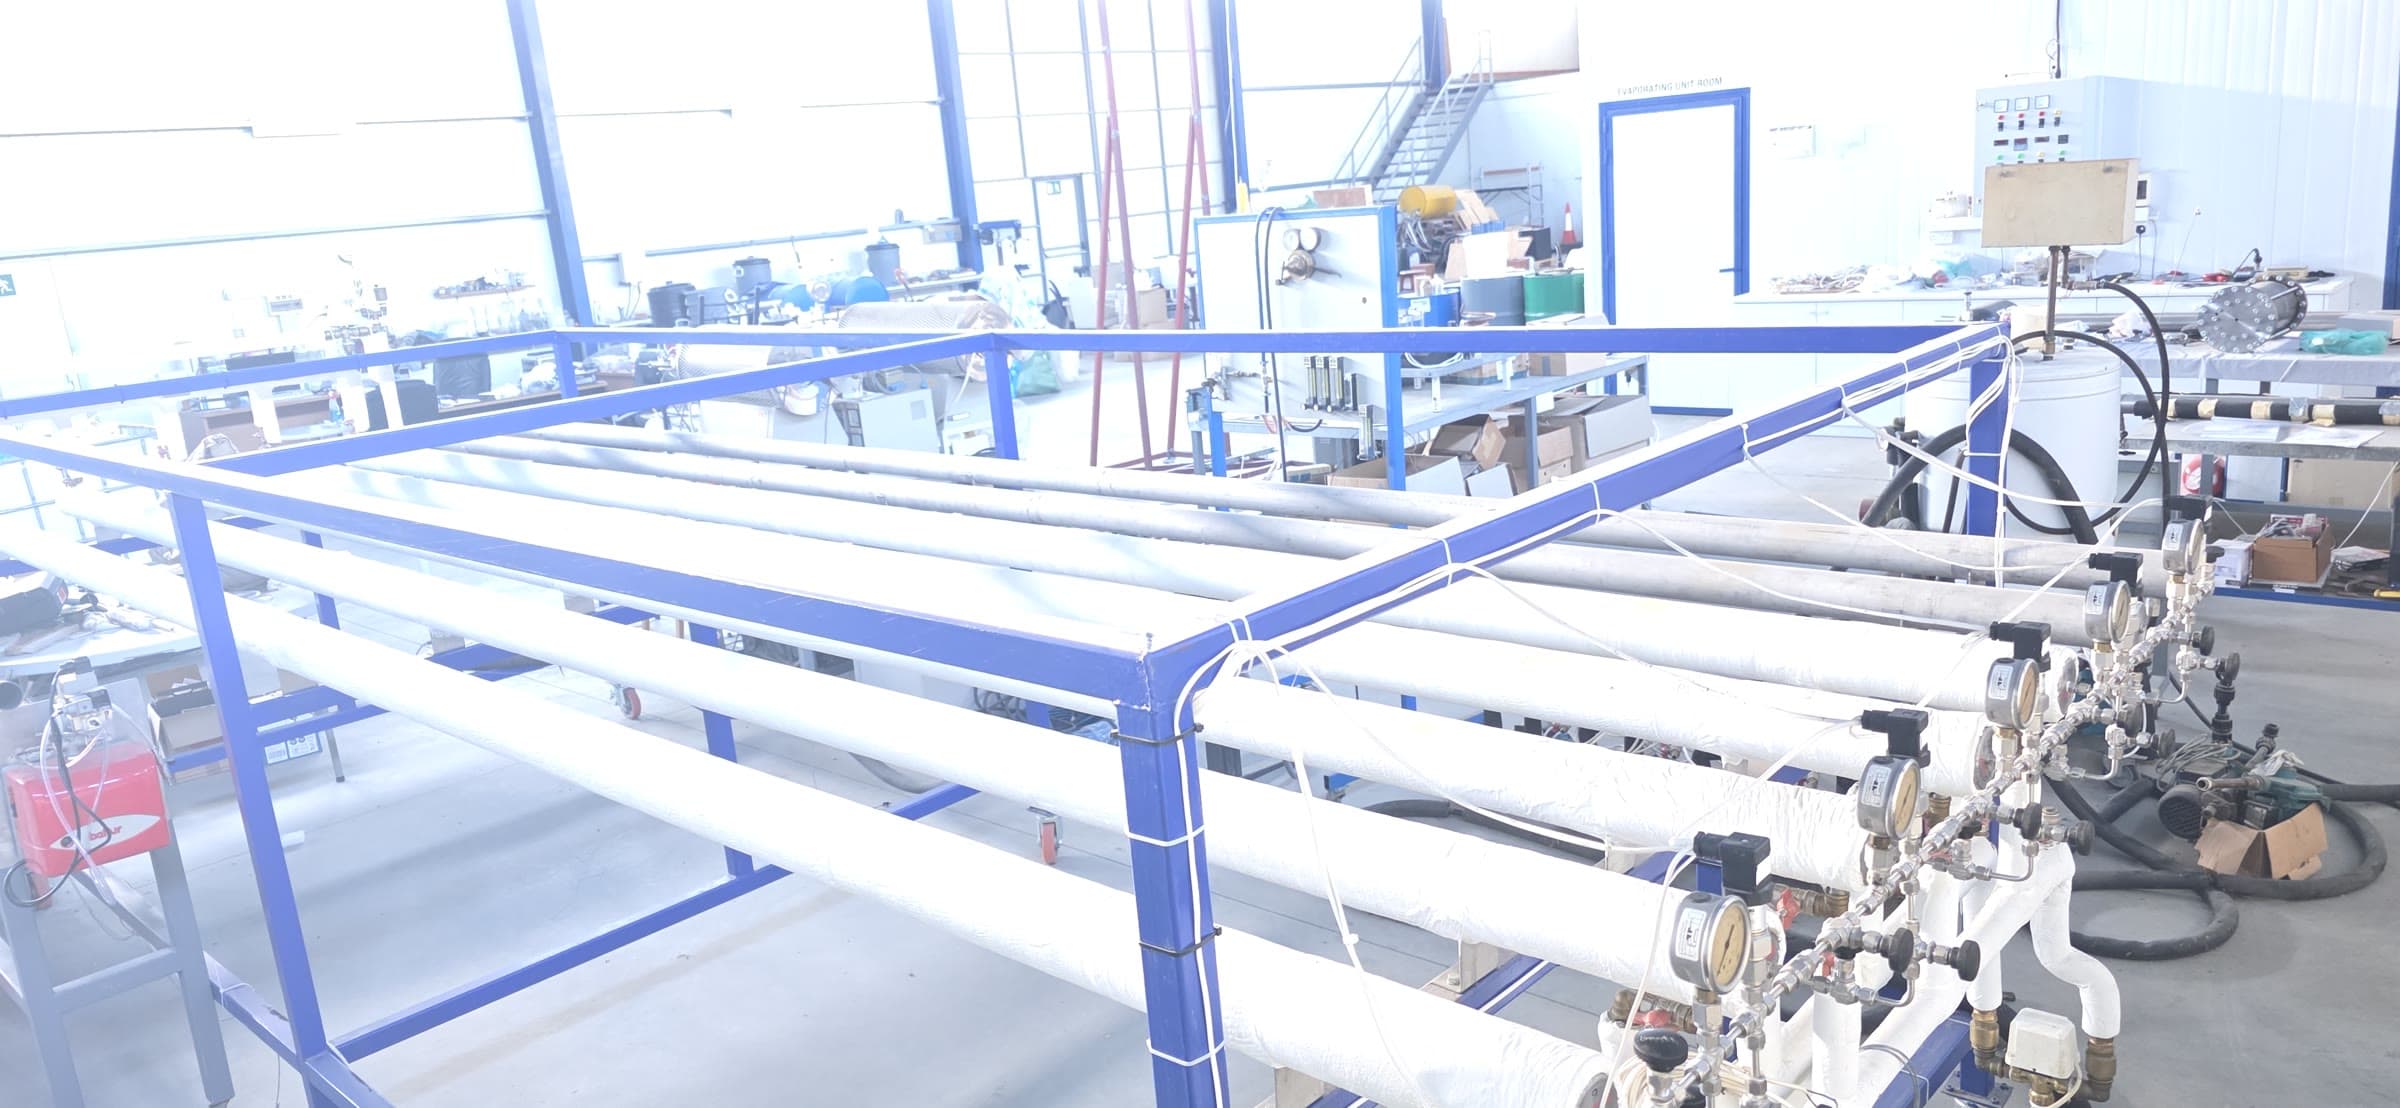
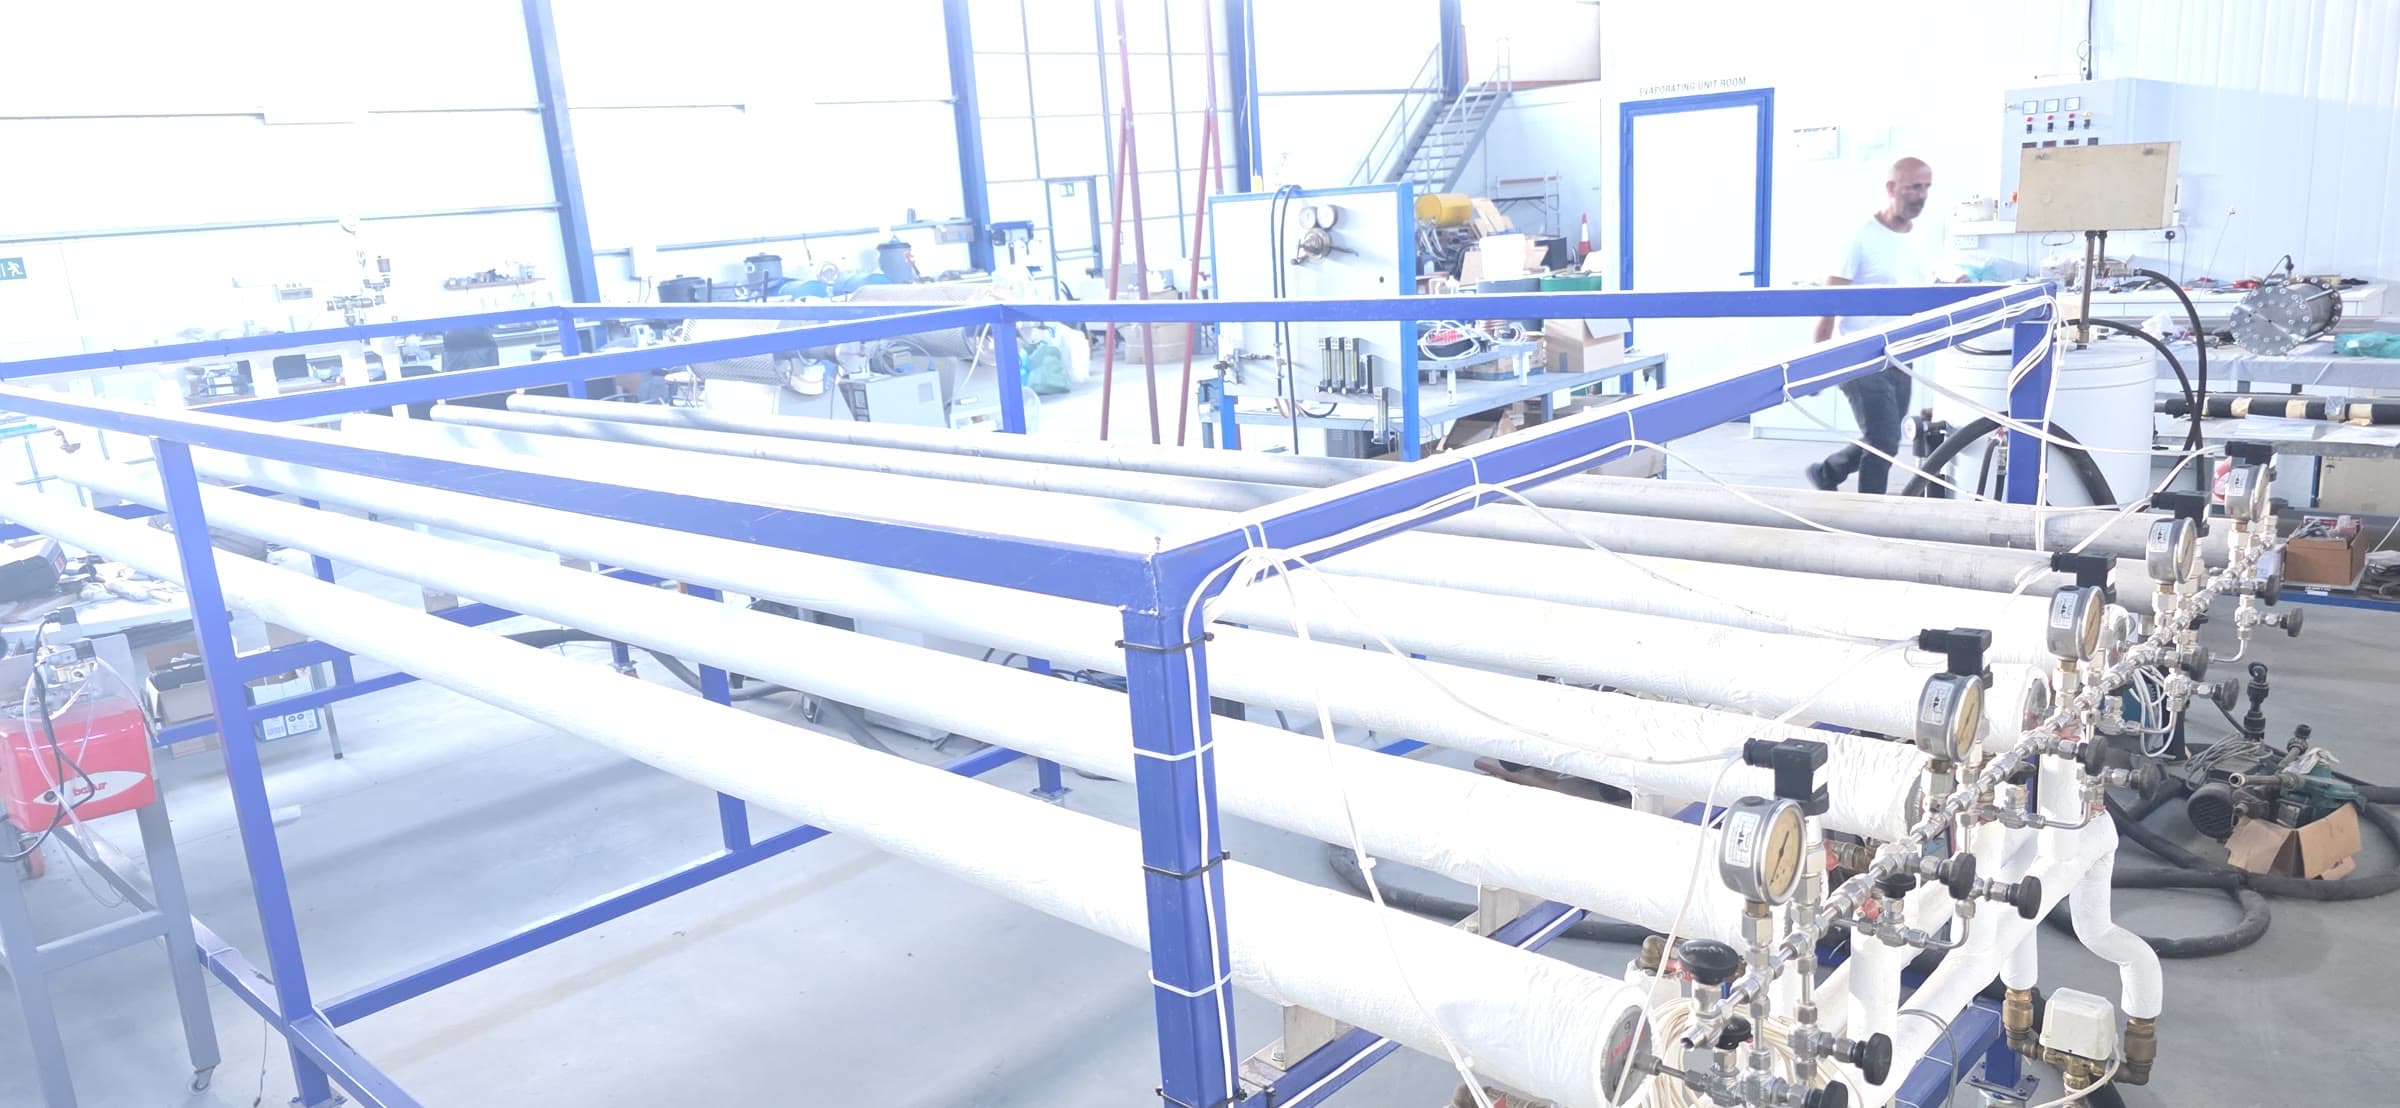
Current physical hardwareBelongs to Hystore Tech LimitedParticipant Identification Code (PIC): 900935225
Historical prototype provenanceHYSTORE TECHNOLOGIES LIMITEDSeparate legal entity associated with ATLAS-H2 and ATLAS-MHC
Digital twinBelongs to KYAMOSInteractive software and visualisation
Hydrogen compressed by heat
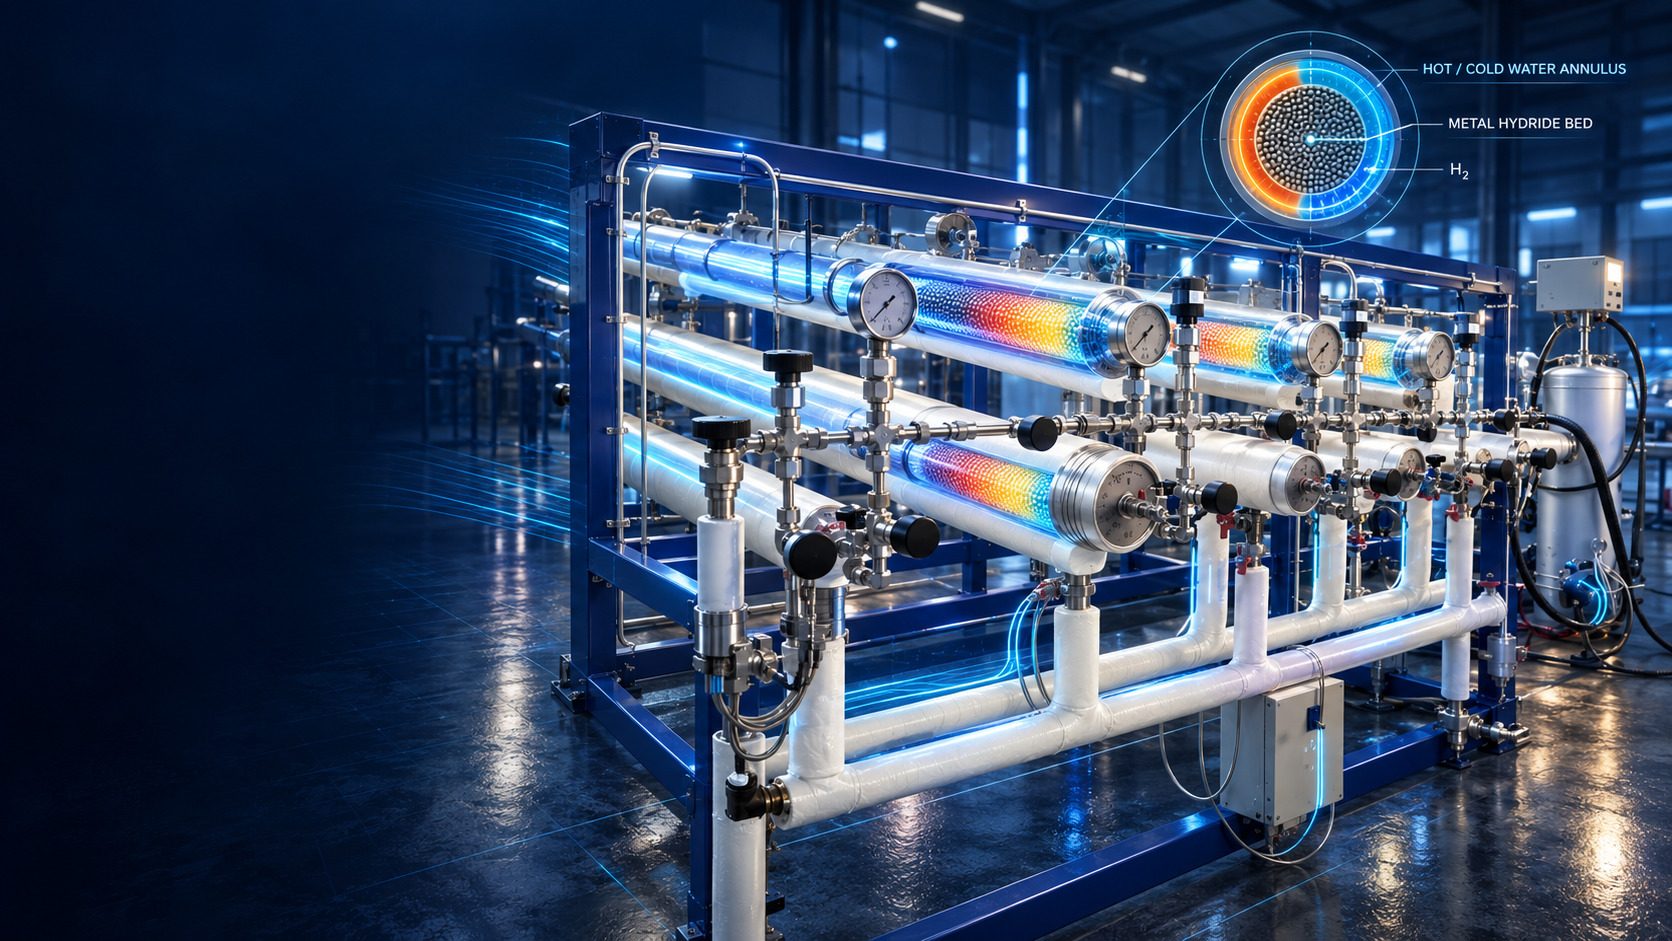
Cold water helps the metal hydride absorb hydrogen at lower pressure. Hot water then heats the alloy and makes it release that hydrogen at a higher pressure. Four pipes repeat the process without a gas-contacting piston.
Explore a labelled hydride-pipe cutaway and a four-pipe compressor system rendering. Select either image to inspect the original at full resolution.
Current physical hardwareHystore Tech LimitedParticipant Identification Code (PIC): 900935225
Historical prototype provenanceHYSTORE TECHNOLOGIES LIMITEDSeparate legal entity associated with ATLAS-H2 and ATLAS-MHC
Digital twin and visualisationKYAMOSInteractive engineering presentation views
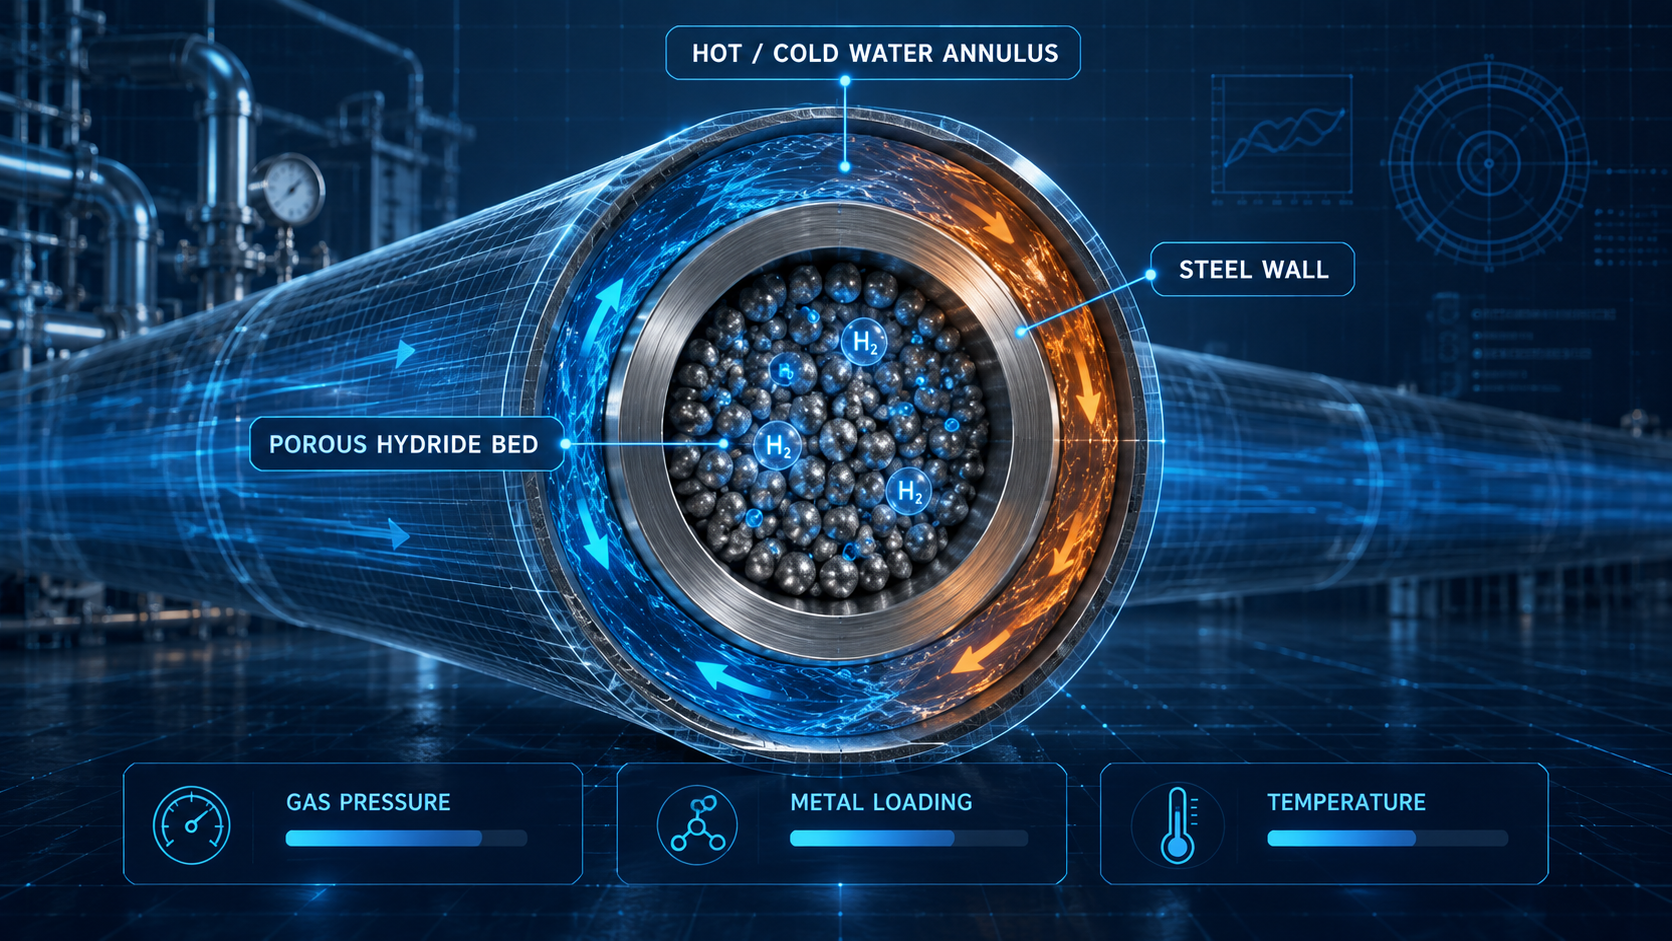
Cold water carries away the heat of absorption. Hydrogen enters the open pore space and is taken into the metal-hydride alloy at lower pressure.
The hydrogen is held inside the alloy rather than simply squeezed into an empty tube. The pipe is isolated before the temperature swing.
Hot water adds heat through the steel wall. As the hydride warms, its equilibrium pressure rises and it is ready to release hydrogen.
Hydrogen leaves at higher pressure when the receiving side is ready. The bed then cools and returns to its absorbing state for the next cycle.
Governing model architecture
Gas leaves the pore space when the alloy absorbs it.
The same mass appears inside the metal, so hydrogen cannot silently vanish.
Pressure drives hydrogen through a bed that resists the flow.
Temperature and loading set the pressure at which the hydride absorbs or releases.
Heat carried by hydrogen, heat conduction and stored chemical energy stay in one balance.
Numerical resolution
The planned 3D solver uses nested 2:1 refinement: each refined level halves the cell width around ports, walls and steep pressure, temperature or reaction fronts while calmer regions stay coarser.
HLLC flux · fifth-order WENO reconstruction · third-order SSP-RK time stepping
LB-MRT lattice flow · conjugate wall heat transfer · conditional turbulence model
A production compressor cell size is not yet frozen. It will be selected only after mesh-convergence tests. The reported grids are controlled component tests, not a claimed six-metre pipe resolution.
These are ideal-gas transport-component checks. Real-hydrogen porous flow, exact hydride kinetics, water/wall coupling, valves and reactive refinement have not yet passed together as one validated four-pipe compressor or facility prediction.
Drag to inspect the pipes, valves, gauges and headers. Select any item to turn it yellow and see what it does, then follow the illustrative pressure cycle below.
YAML-defined equipment view
Drag to rotate · pinch or wheel to zoom · choose any item to highlight it in yellow.
Glowing H₂ markers move and change from blue to amber with the illustrative cycle; their speed is explanatory, not measured gas velocity.
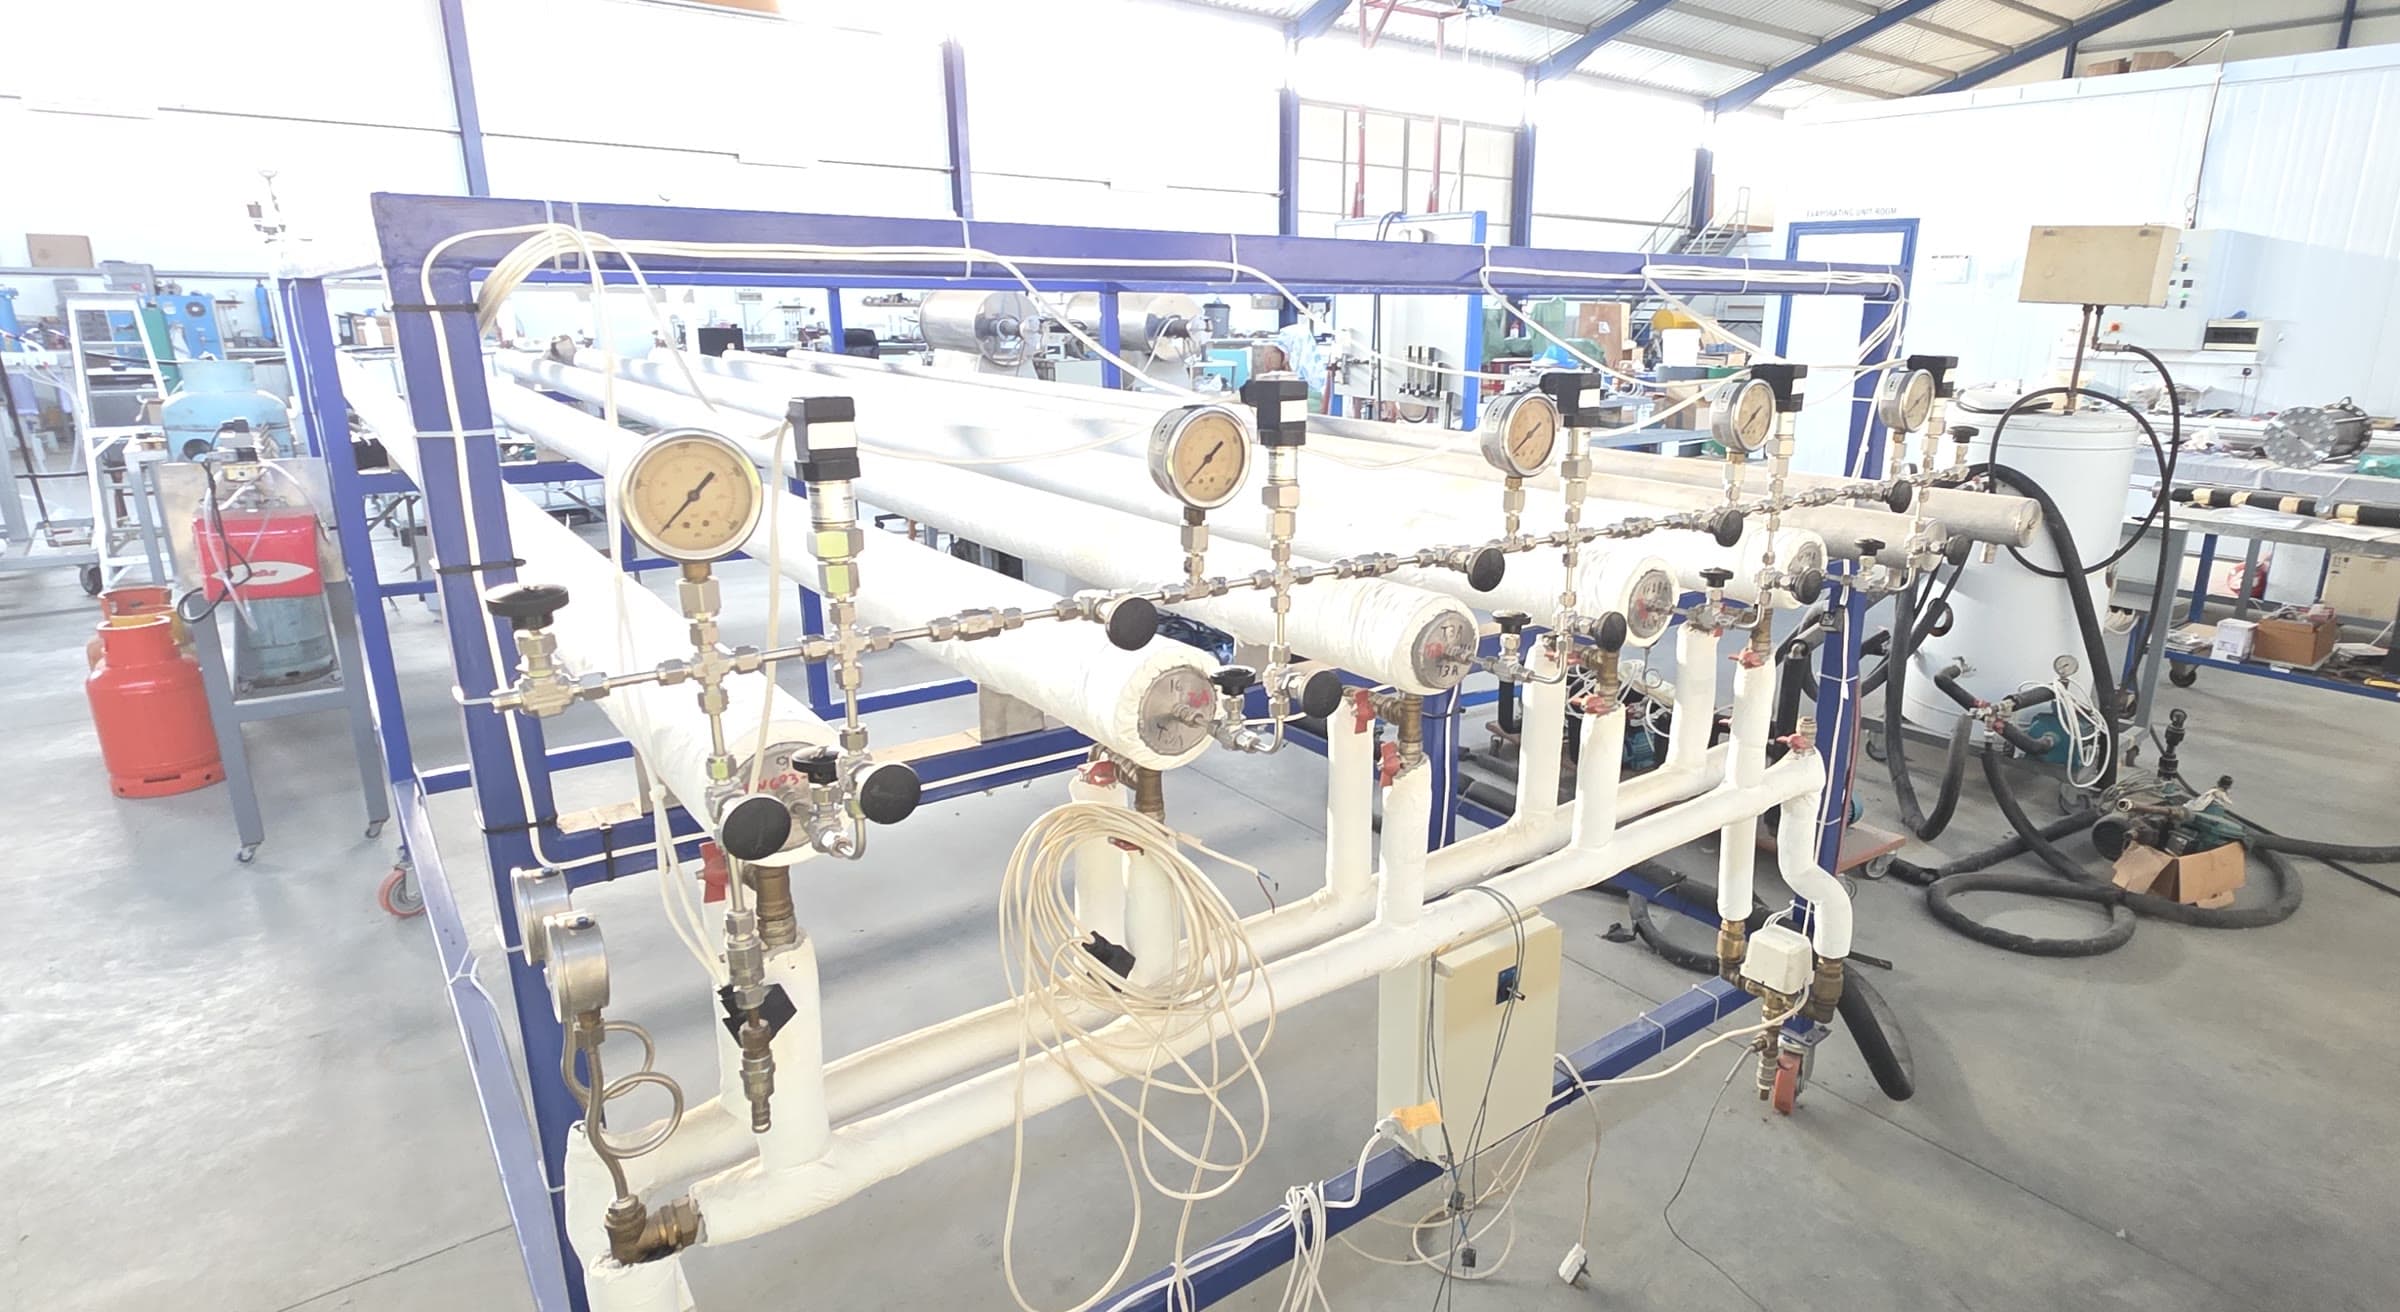
The four 6 m pipe bodies use the recorded tube and jacket dimensions. Valve, gauge and header positions help explain the visible equipment only; exact installed tags, routes and switching order still require an approved plant drawing.
Animated hydrogen view
The brighter, faster H₂ markers and blue-to-amber colour shift illustrate rising relative pressure. They do not represent measured molecule speed or live plant flow.
Pipe 01
Reported pair 1 + 3
Cool · absorb
Pipe 02
Reported pair 2 + 4
Cool · absorb
Pipe 03
Reported pair 1 + 3
Cool · absorb
Pipe 04
Reported pair 2 + 4
Cool · absorb
Time evolution
Shared cursor · normalised time
Teaching view only. Time is normalised and pressure is relative to an illustrative target; no bar values, material kinetics, installed stage order or valve sequence are inferred. The four reported pipes and pairs 1 + 3 / 2 + 4 are shown, but their installed stage mapping remains unconfirmed.
This is a read-only teaching animation. It does not predict facility pressure, connect to plant equipment or change any physical controls.
Animation ready at cycle start.
Select a pipe and compare the linked pressure and capacity responses from the partner workbook. This detailed view is separate from the illustrative time animation above.
One selection connects the pipe information, pressure–composition–temperature results and comparison charts.
Selected result
Interactive result curves
Select a point or branch on either chart; both charts and the system map stay synchronised.
Pipe 1 · LN603-2A
Midpoint pressure across the indexed temperatures
Tap or click any point
Pipe 1 · LN603-2A
Workbook capacity across the indexed temperatures
Tap or click any point
Linked result report
absorption branch across all four pipes
Hardware basisFour 6 m pipes and the reported 1 + 3 / 2 + 4 operating pairs.
Result basisPartner-supplied PCT fit summary, presented as 24 indexed temperature and branch results.
Reference mappingThe interactive reference links the four pipes to material positions A–D.
Engineering exploration interface. Values retain their source-workbook units and the controls update this reference scenario only.
Selected Pipe 1, reference position A, LN603-2A, 20 degrees Celsius, absorption, 9.50 bar.
4 reported pipes are represented in this explorer.For hydrogen-system researchers and engineering partners. Tell us about your operating pressures, temperature cycle, material data and study objectives.
Pricing: quoted per project. Scope, computing needs, validation checks and support determine the quote. Contact us to agree access and deliverables before work starts.
This is a research and demonstration workflow, not a certified compressor design or operating instruction. Hardware and digital-twin ownership remain as stated above.