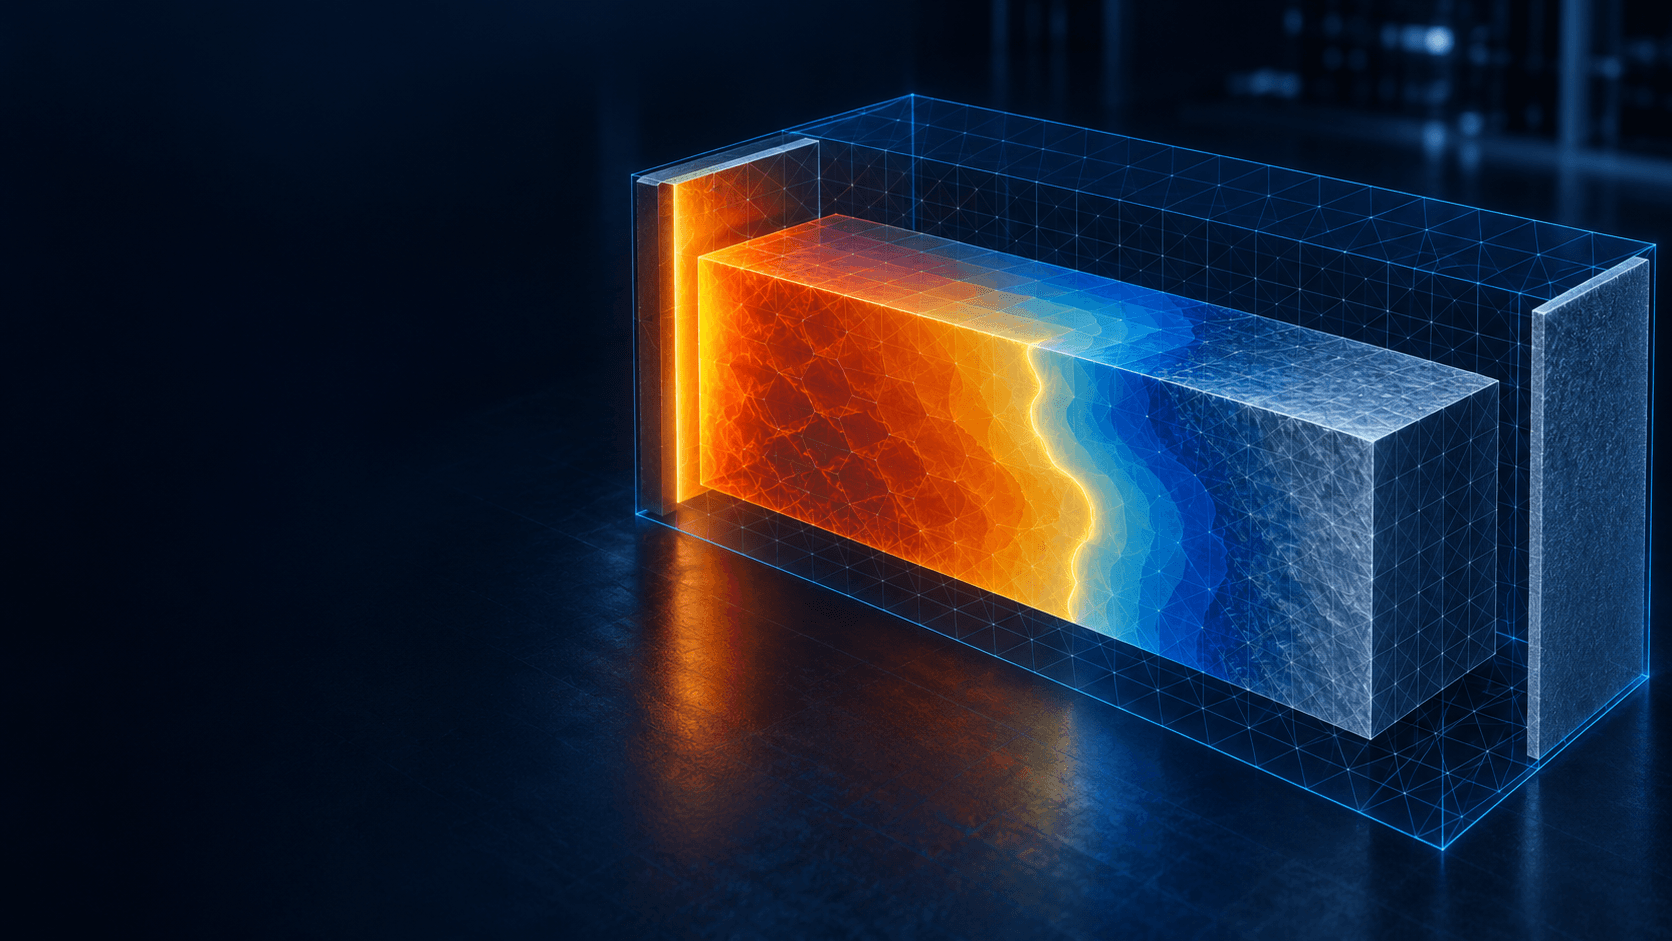
Presentation concept illustration of a hot melting region beside a cooler solid region.

KYAMOS / MAT4EU study

PHASE-CHANGE HEAT STORAGE

Heat in.
Heat held.
Heat returned.

Explore how a material stores heat as it melts, then releases it as it freezes.

Original figures from a checked aluminium-silicon calculation. A clear view of what the model shows and what still needs a real sample test.

Presentation artwork: a concept illustration, not a calculated field or laboratory image.

Numerically verified screening Checked calculations under stated assumptions. Independent experimental validation remains pending.

01 / The idea

A material can hold heat
in a change of state.

Think of ice melting: heat goes into the change from solid to liquid. Here, the assumed material is AlSi12, an aluminium-silicon alloy, with a much higher melting temperature.

01

Warm the solid

Heat moves from the controlled wall into the sample.

02

Store heat by melting

Melting absorbs latent heat: energy used to change solid into liquid.

03

Cool and freeze

The material gives back heat as it returns to a solid.

The assumed sample

40 × 30 × 10 millimetres

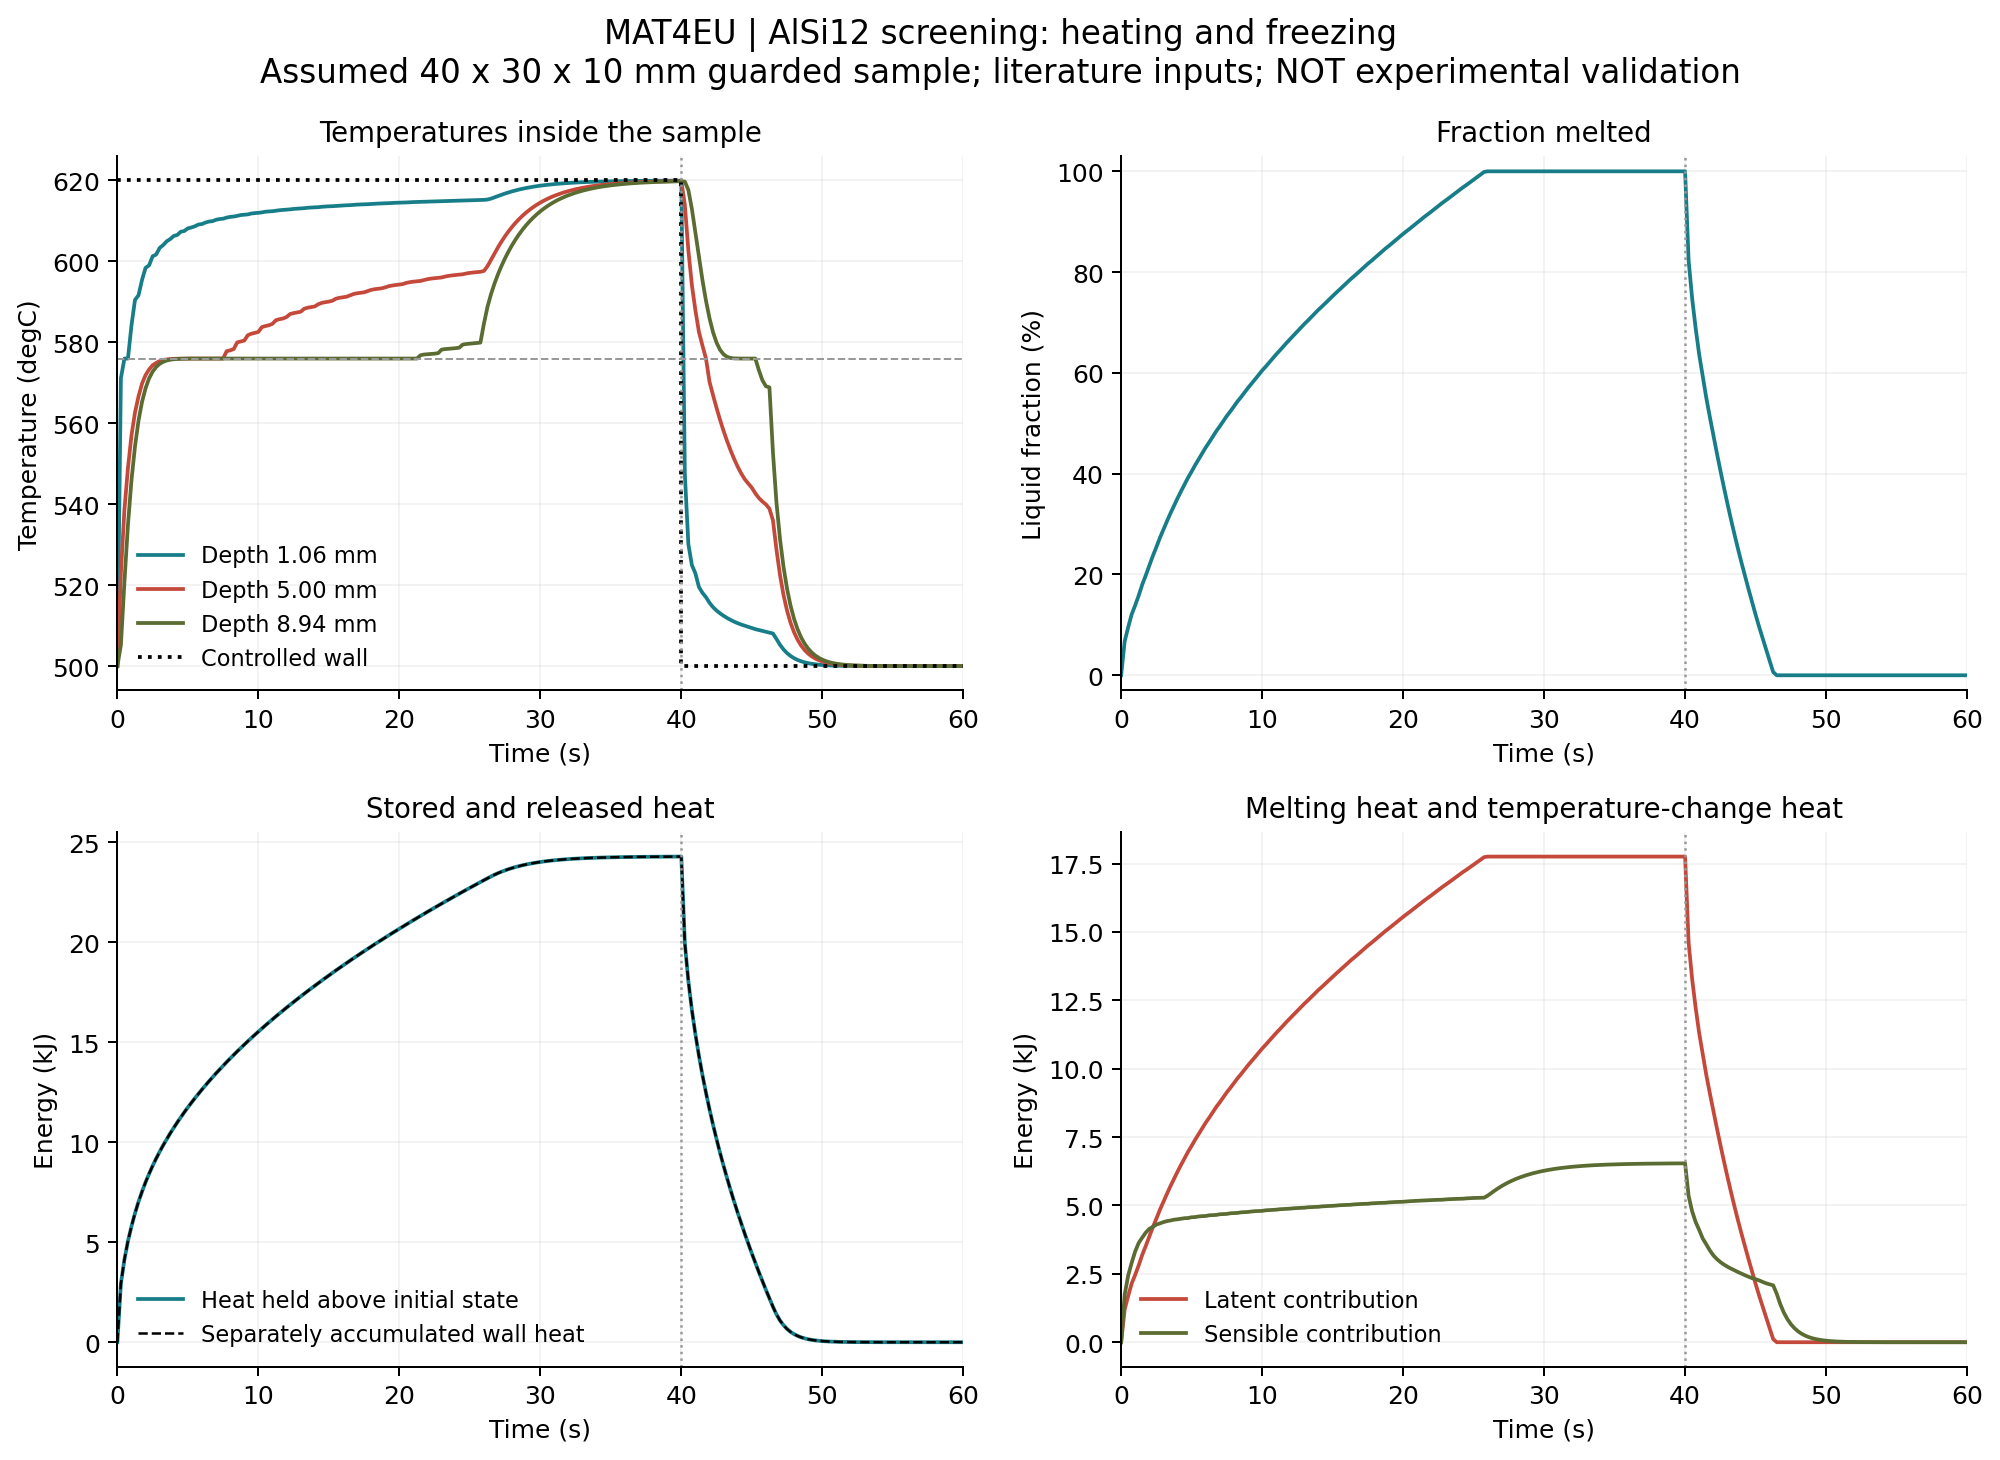
31.704 grams of dense alloy. Starts at 500 degrees Celsius. The assumed melting point is 576 degrees Celsius.

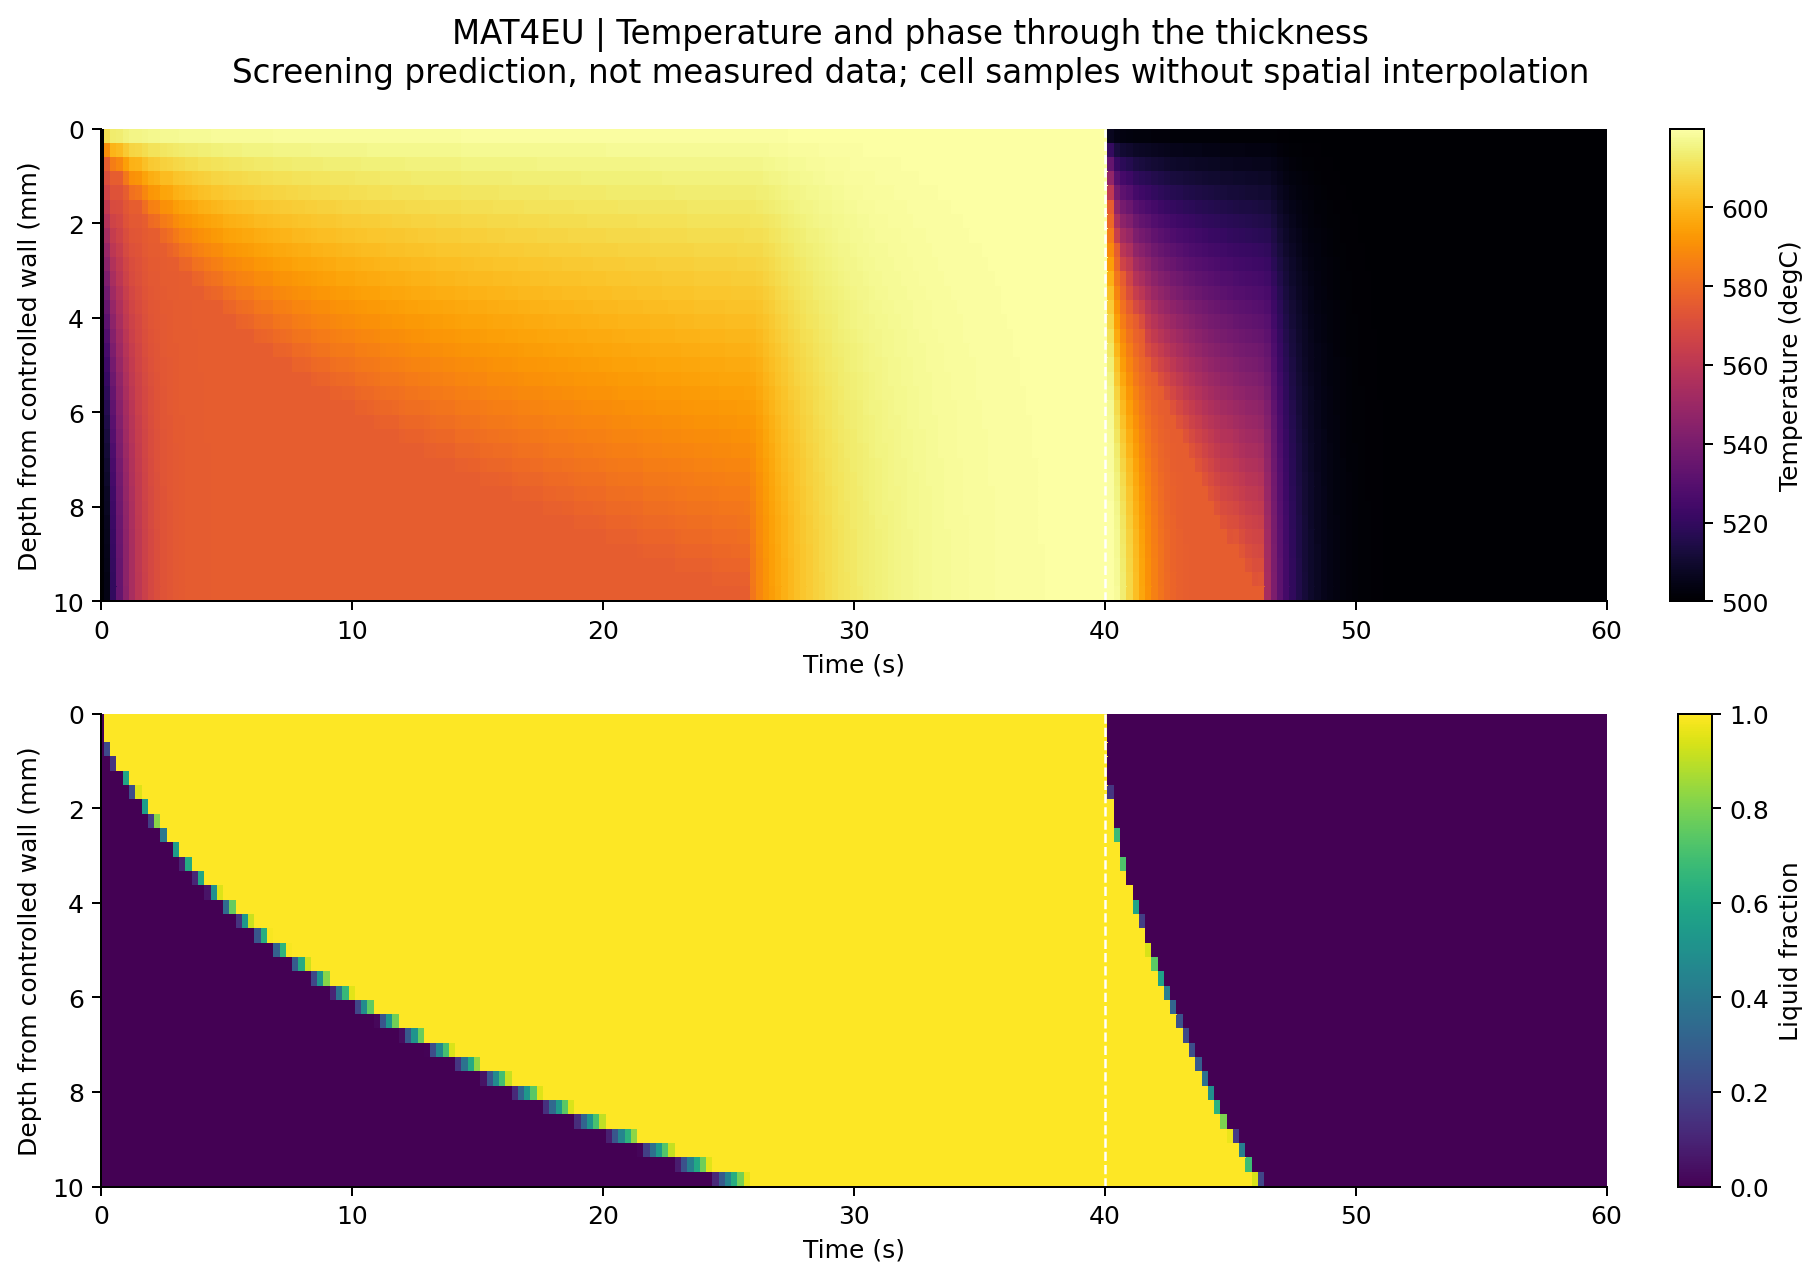
0-40 secondsWall held at 620°CHeating and melting
40-60 secondsWall held at 500°CCooling and freezing

°C means degrees Celsius. One wall changes temperature; all other walls are insulated. Heat moves by conduction, meaning heat spreading through the material. Density stays fixed. The working grid divides the sample into 5 × 3 × 33 small calculation blocks.

02 / What the calculation predicts

One sample. One complete cycle.

24.293 kJHeat stored after 40 seconds
24.293 kJHeat released over the next 20 seconds
25.25-25.50 sTime to 99% melted
6.00-6.25 sTime to 99% frozen after cooling starts

kJ means kilojoules, a unit of heat energy; s means seconds. These are conditional simulation predictions. Near-complete recovery follows from the ideal insulated setup and does not establish device efficiency. Time brackets come from saving results every 0.25 seconds, not measured uncertainty.

03 / The original evidence

Six figures.
The full story.

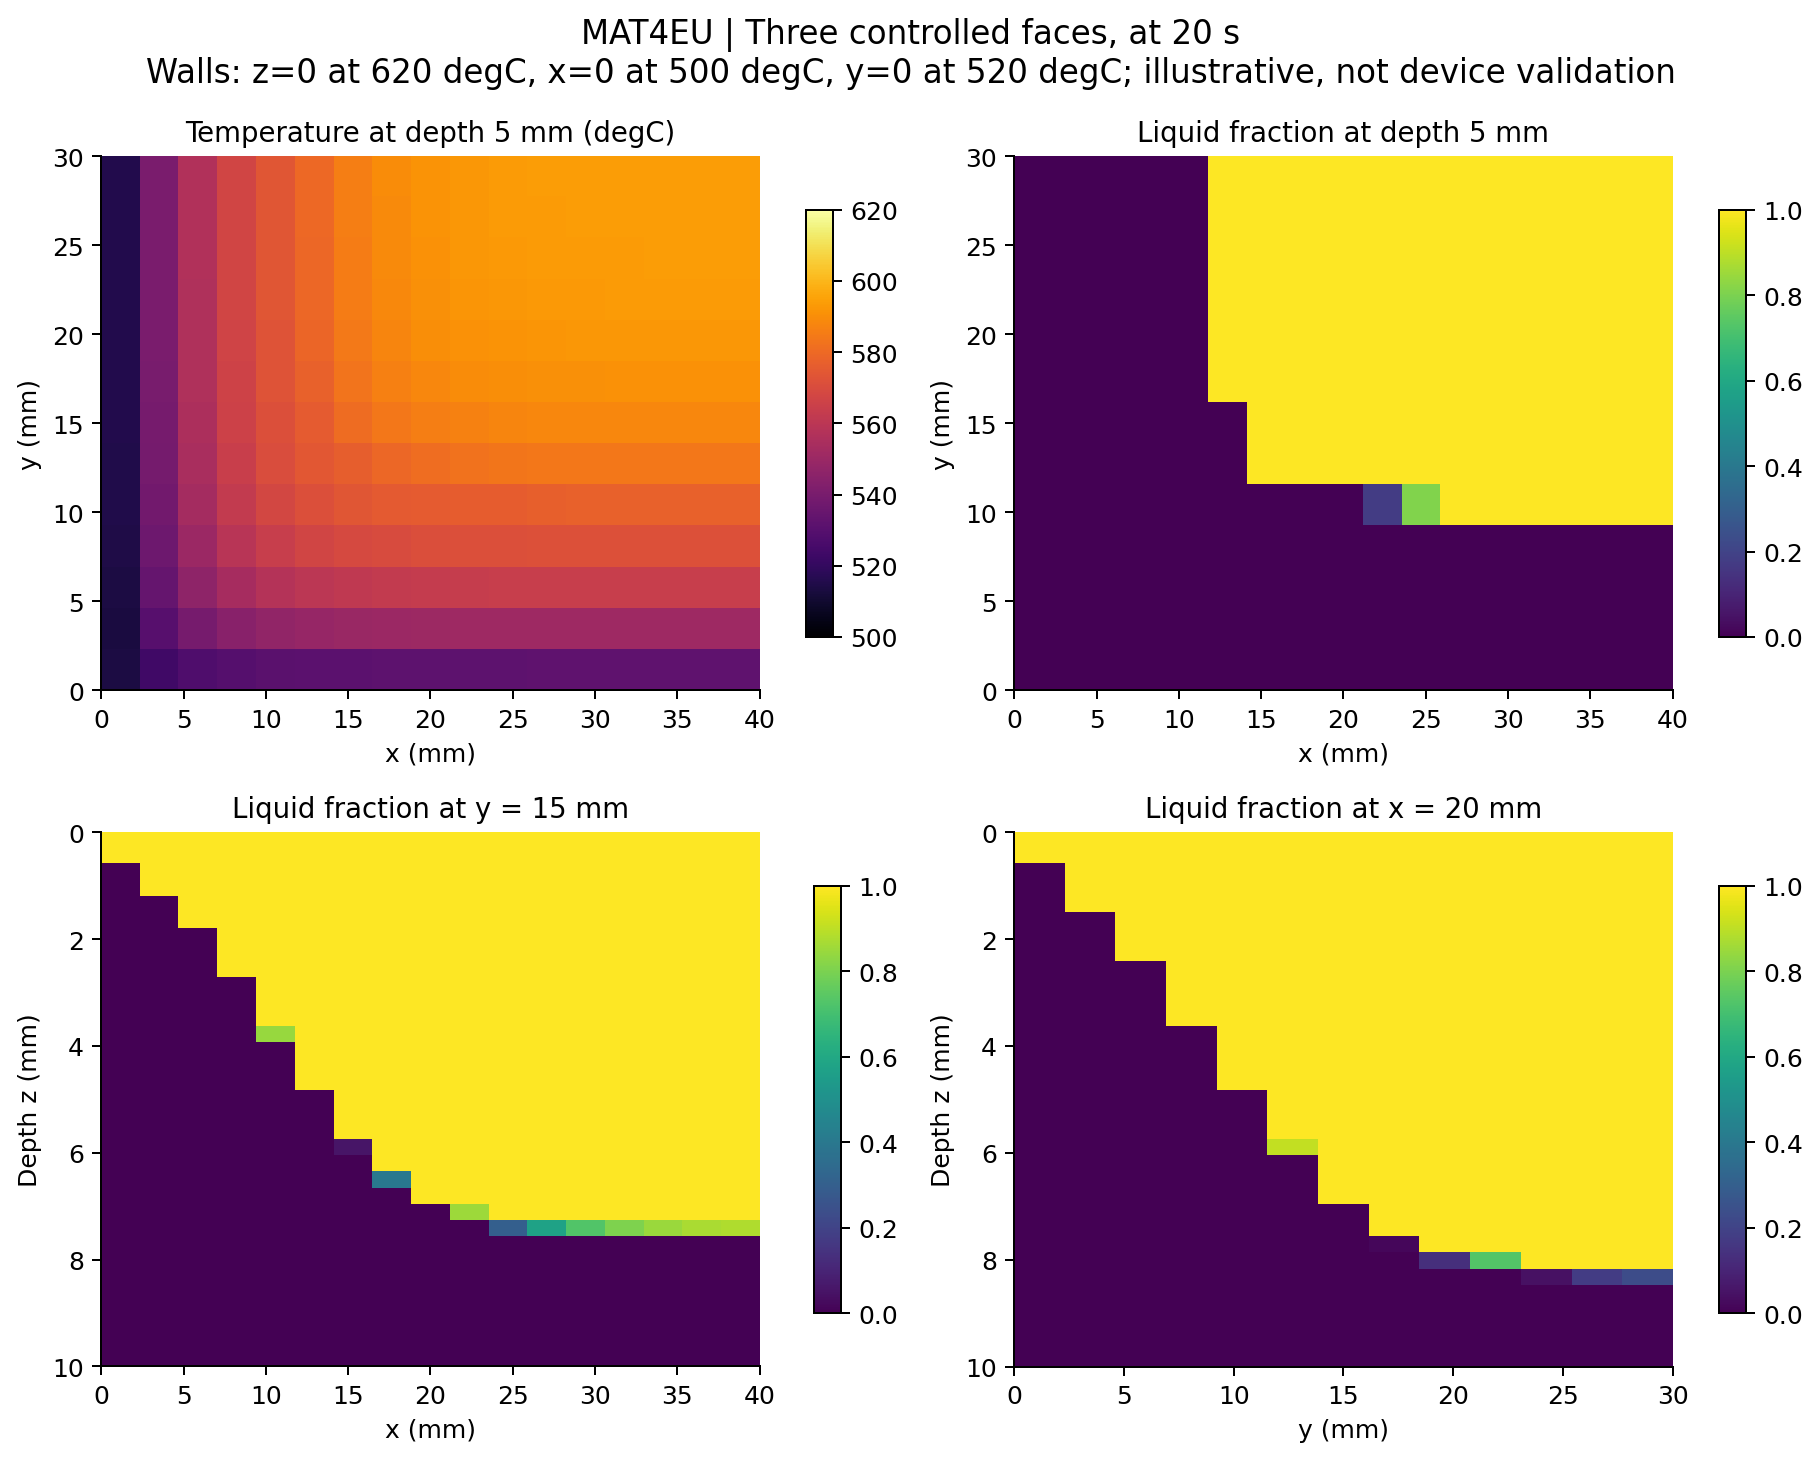
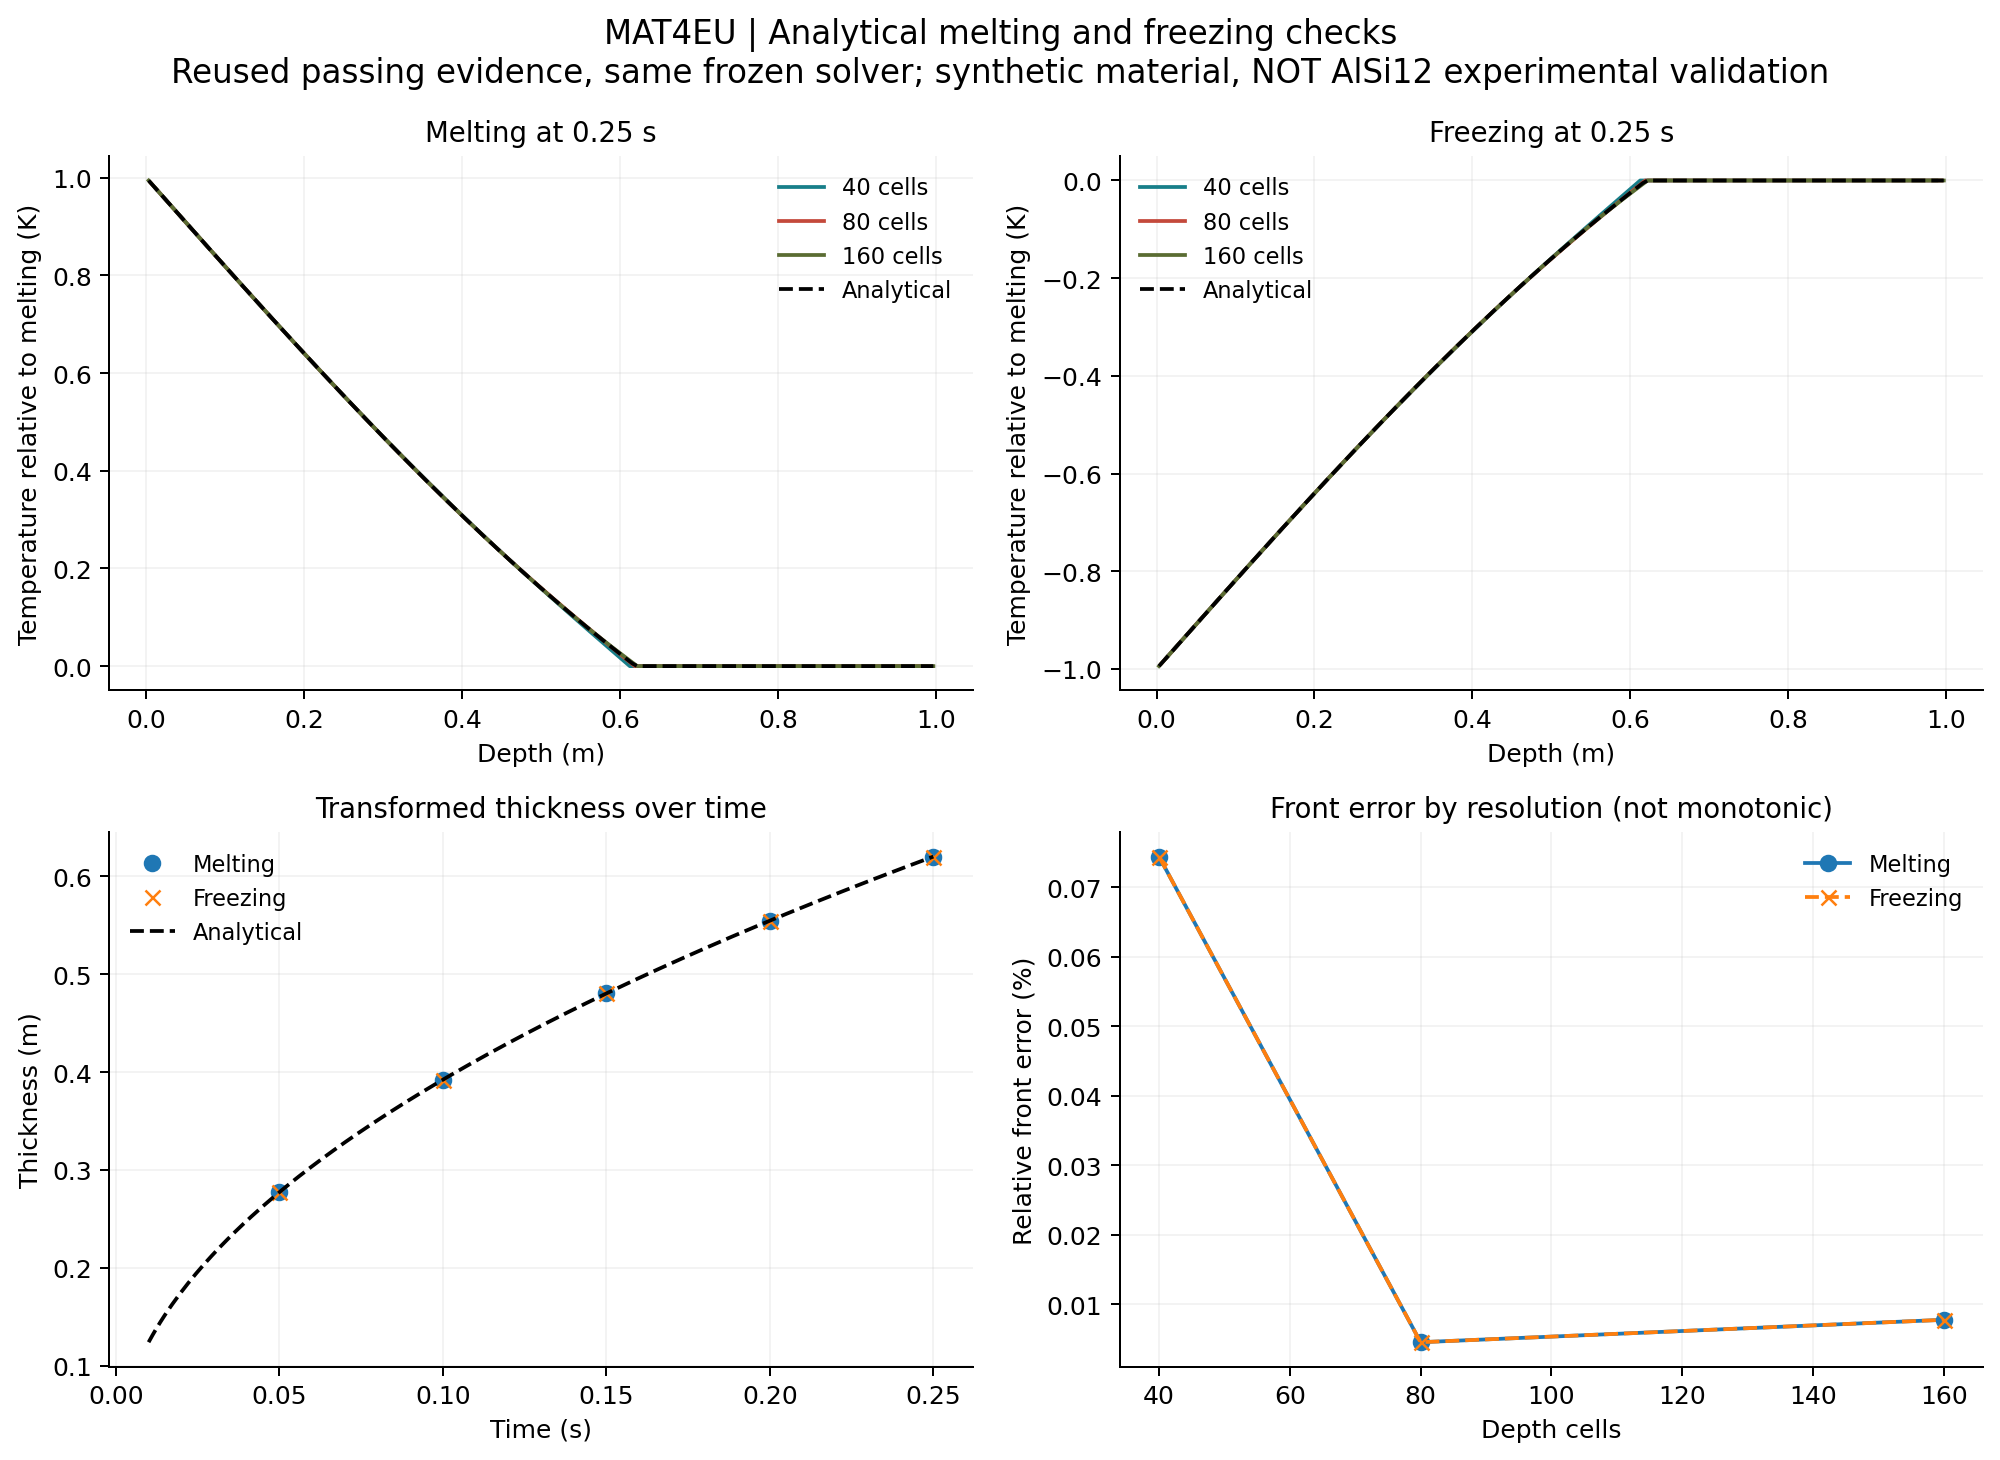
Select a figure to explore the saved results, learn how to read the plot, and see its limits. Every plot is the unchanged original from the report and figure presentation.

04 / Material sensitivity

The inputs change
the answer.

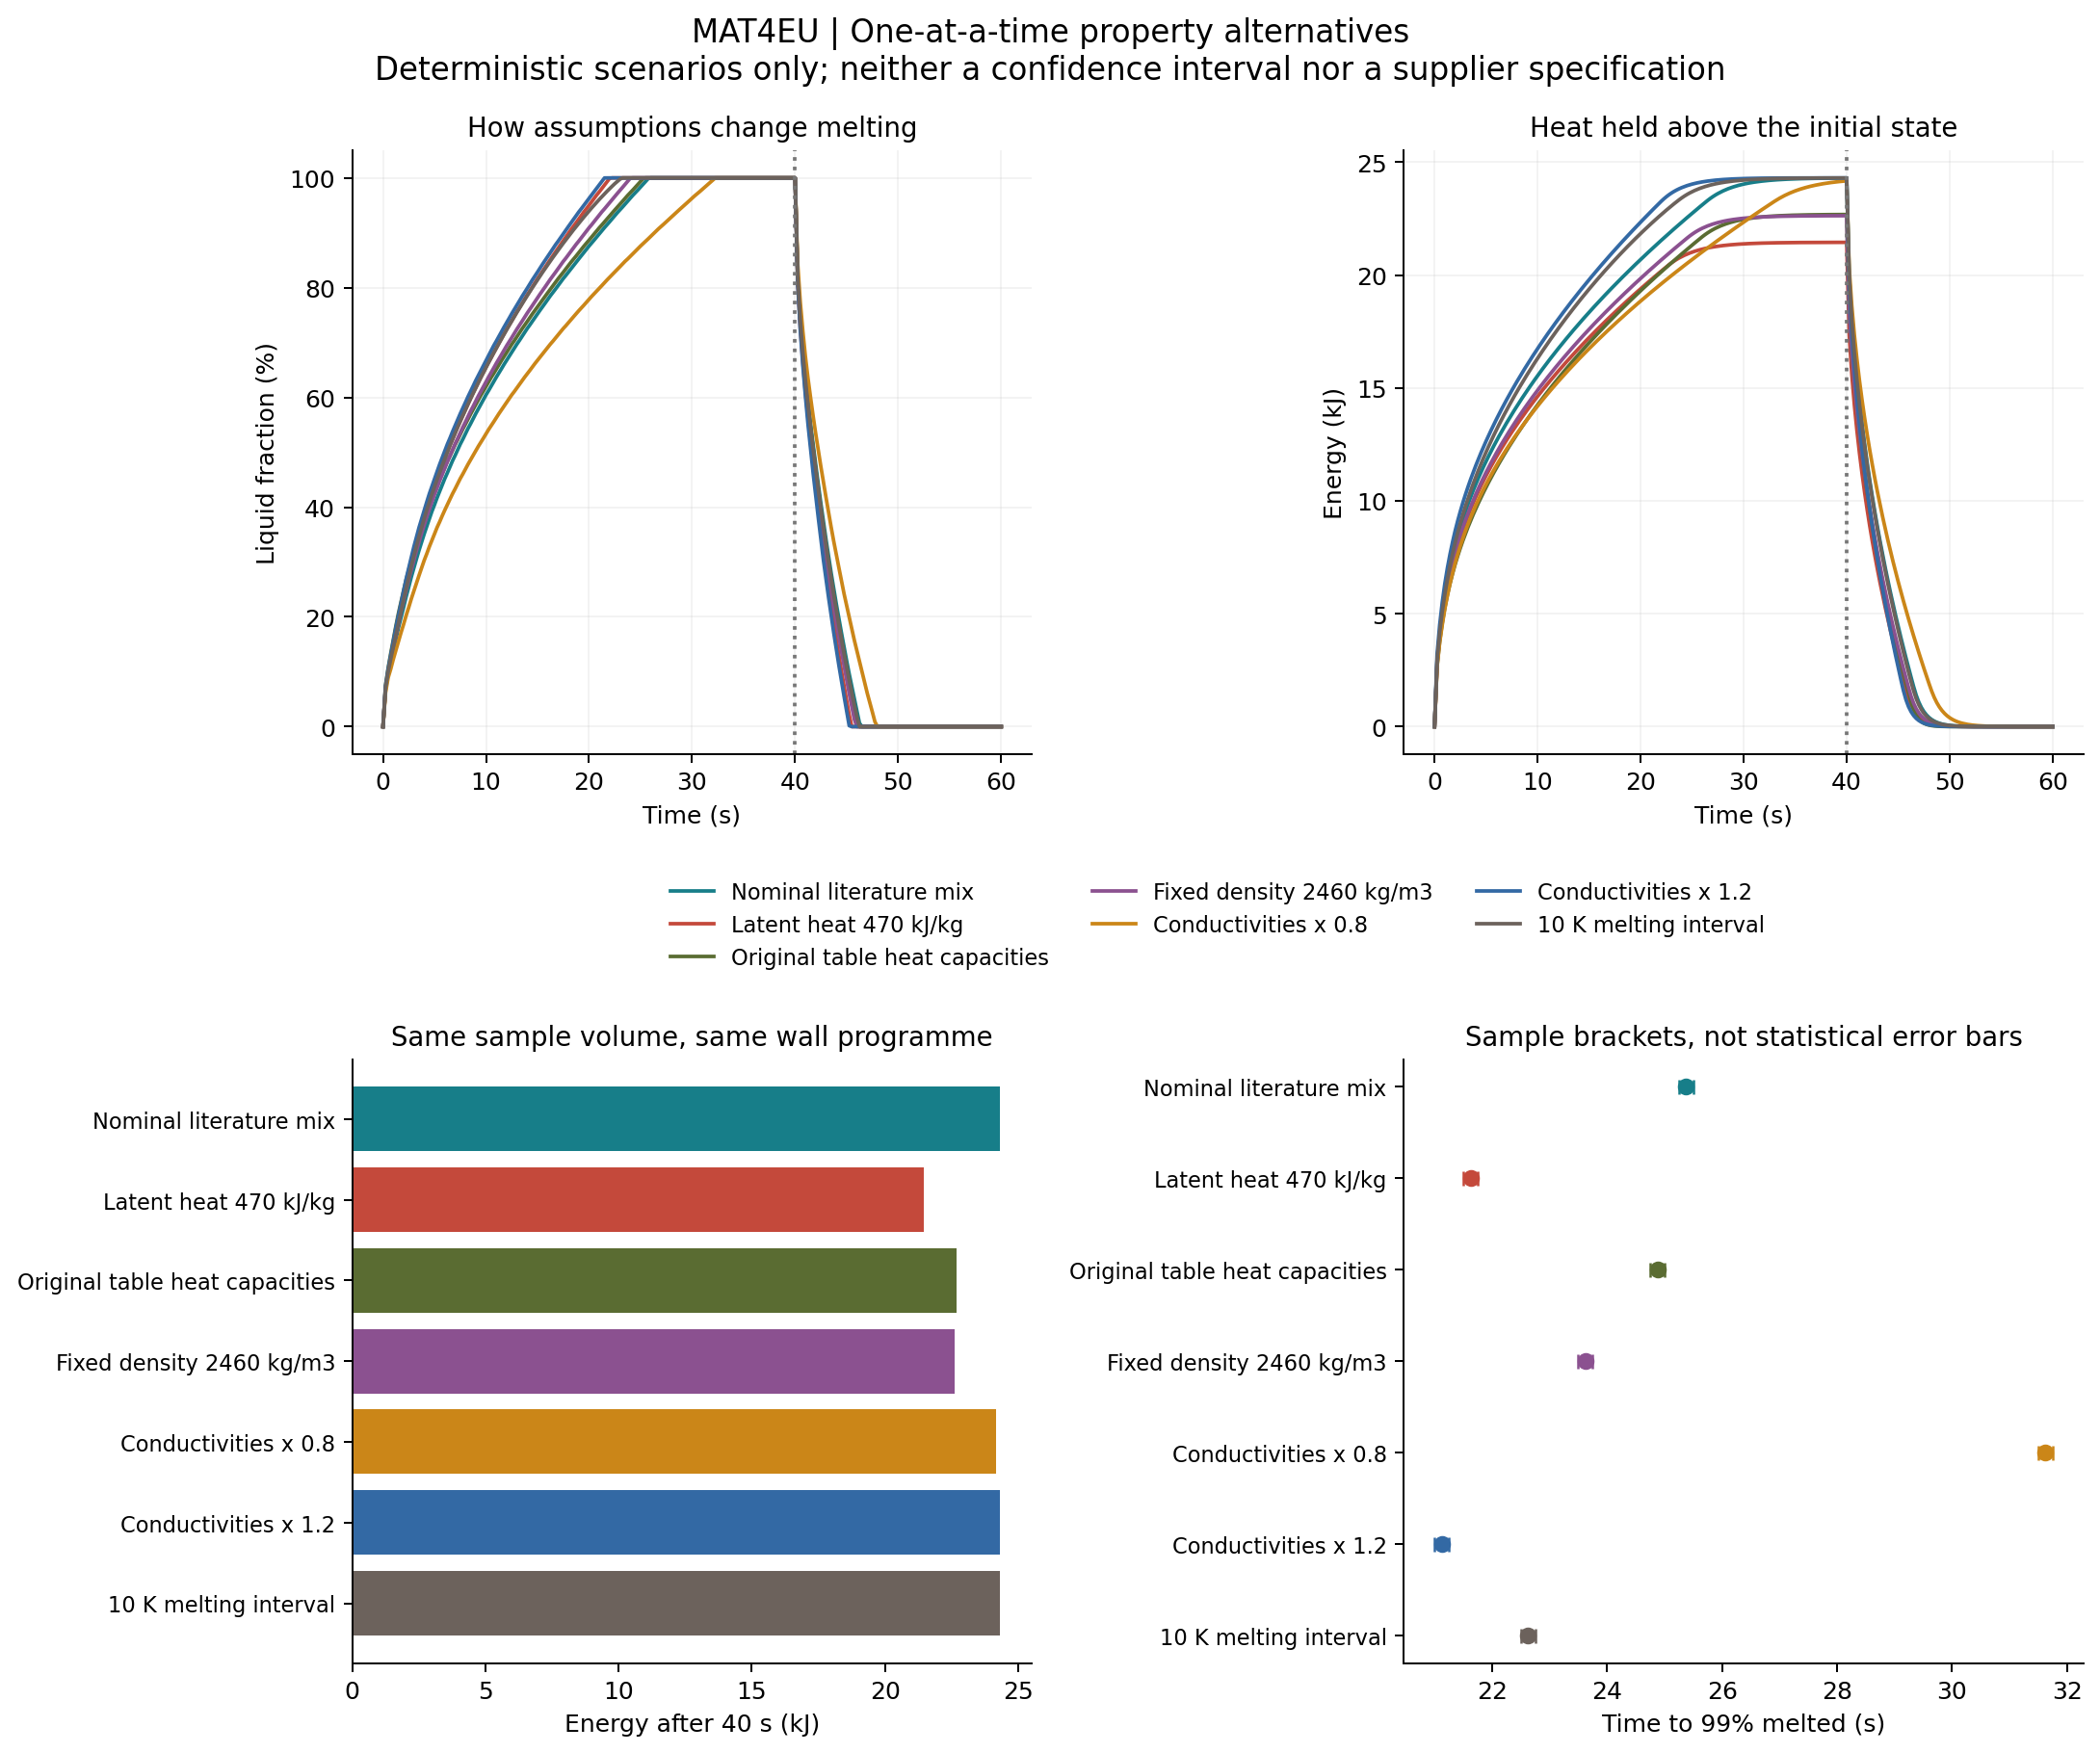
Seven scenarios change one material assumption at a time. Melting heat affects stored energy; heat conduction strongly affects how quickly the sample melts.

Same sample volume and wall programme in every scenario
Material assumptionHeat at 40 seconds
kilojoules
Time to 99% melted
seconds
Nominal published-property mixReference case24.29325.25-25.50
Melting heat: 470 kilojoules per kilogram21.44521.50-21.75
Original table heat capacities22.67924.75-25.00
Density: 2,460 kilograms per cubic metre22.62423.50-23.75
Heat conduction: 20% lower24.16931.50-31.75
Heat conduction: 20% higher24.30021.00-21.25
Melting spread over 10 degrees24.29822.50-22.75

These alternatives are not statistical confidence intervals or measured supplier limits. Changing density at fixed volume also changes mass. The actual material needs to be measured.

05 / Evidence, with its boundaries

What has been checked.

Mathematical verification434 / 434

Checks passed across 31 cases

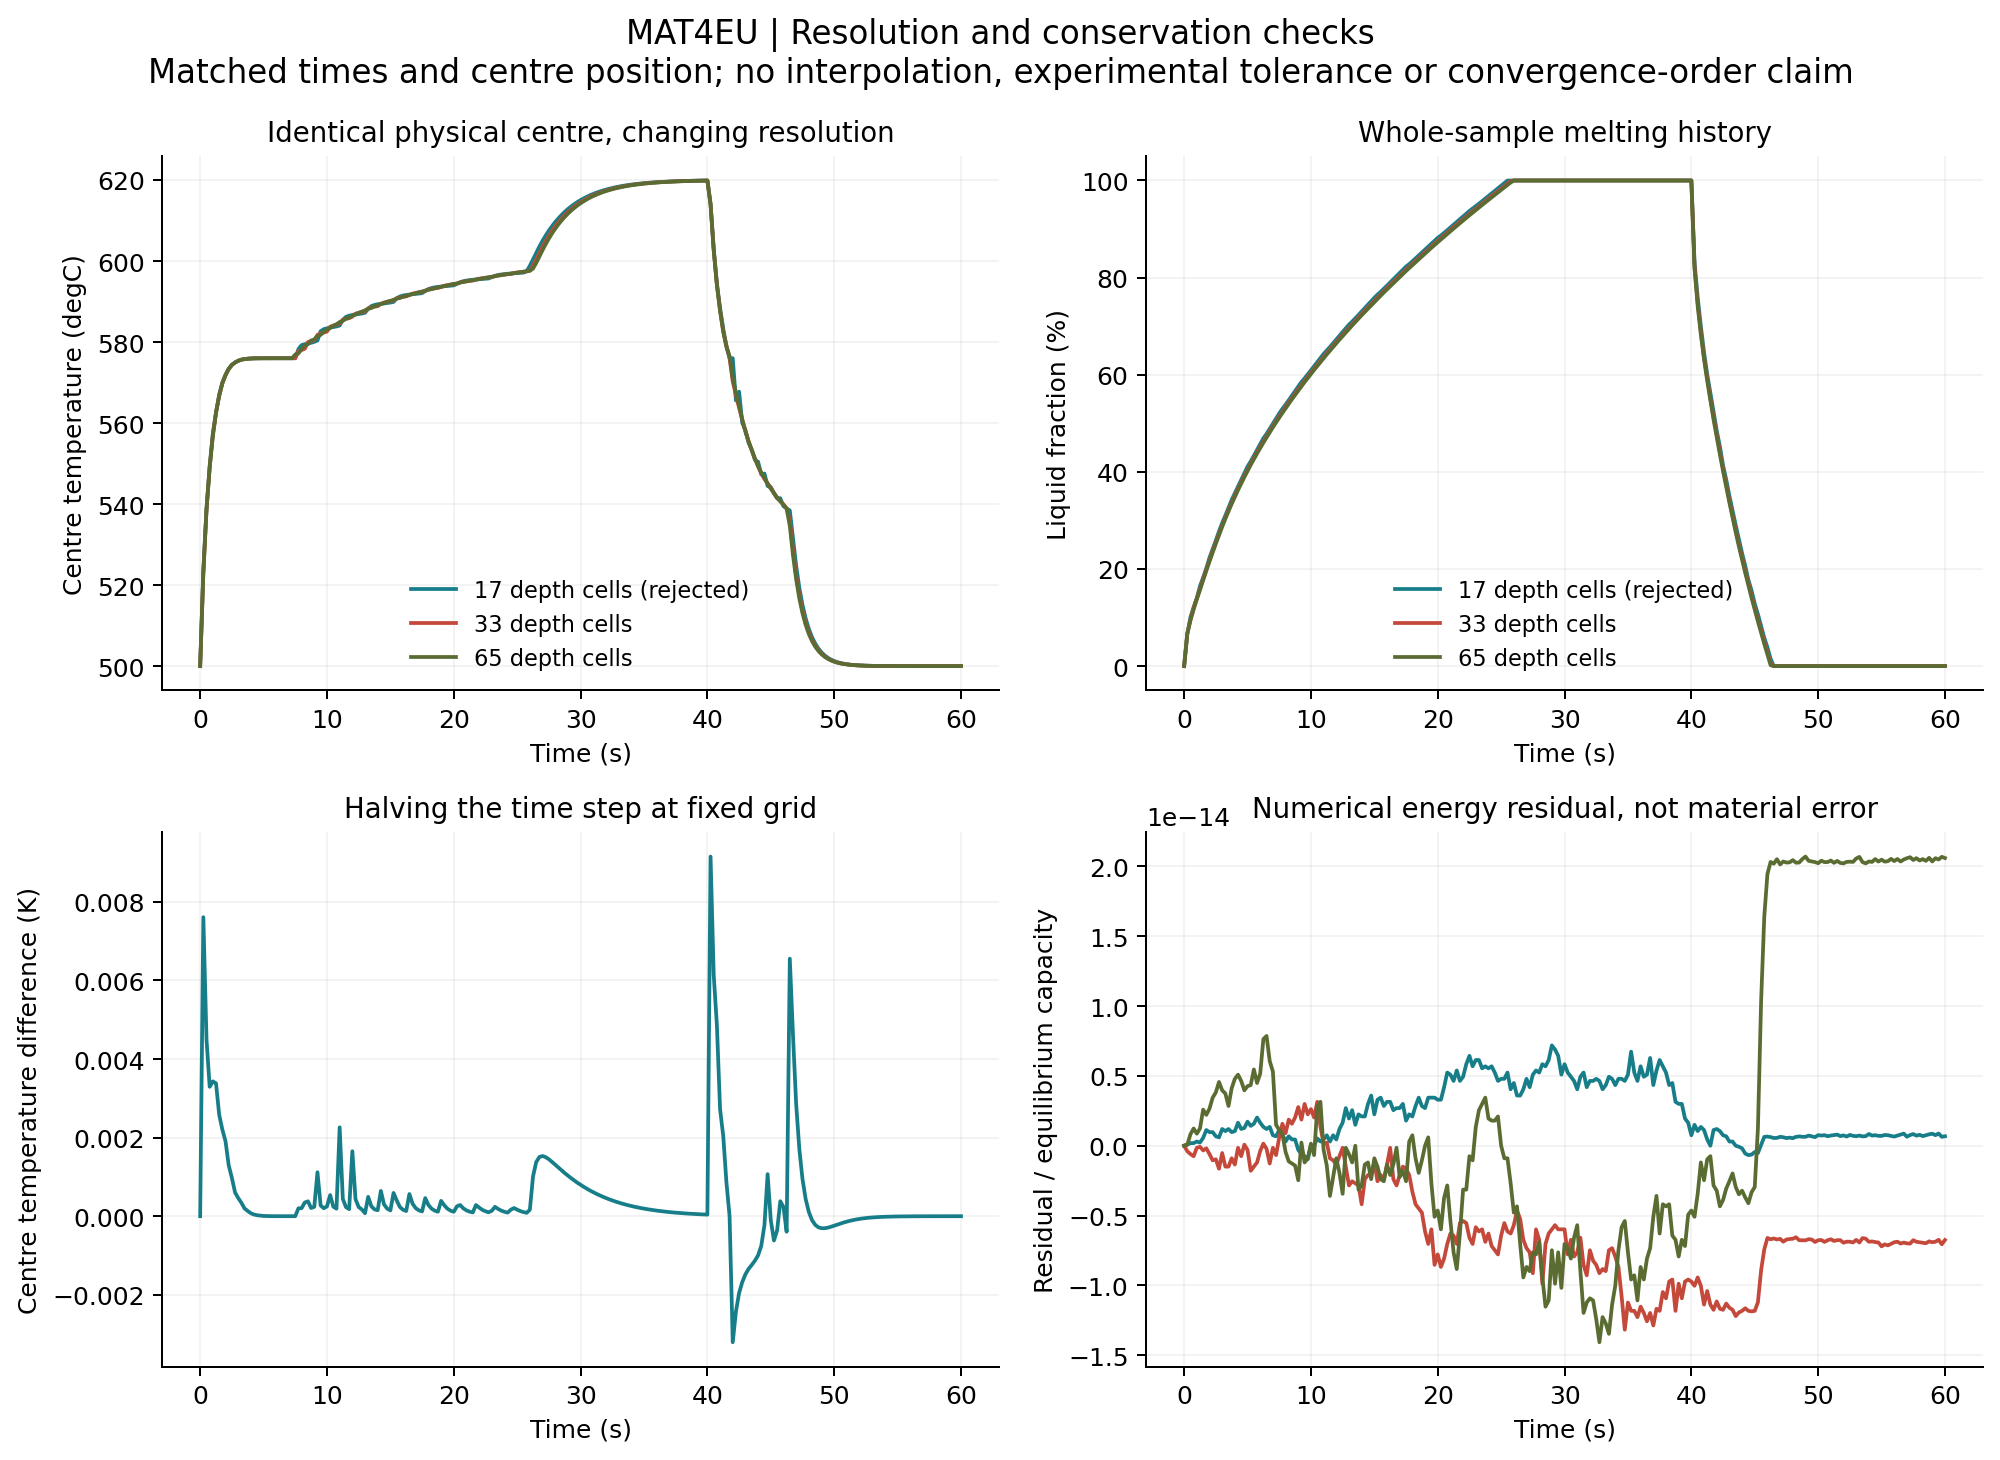
An earlier test set compared simplified melting and freezing against exact mathematics. The finest-grid boundary-position error is 0.00773%. These tests use an invented test material.

Error did not fall steadily with finer grids. No measured convergence order is claimed.

Selected working grid: accepted219 / 220

One coarse grid was rejected

The 17-cell grid exceeded the centre-temperature limit. The originally selected 33-cell working grid passes the finer-grid and shorter-step comparisons.

219 of 220 screening checks passed. The coarse grid is not used; the original failed check remains in the evidence below.

Independent experiment: pendingNext step

Measure a real material sample

Compare measured heating and cooling curves with the same sample conditions. Record the material batch, sensor calibration, repeat cycles and heat losses.

Material-specific accuracy, storage-unit charging time and device efficiency are not established.

Model scope and calculation checks

Raw screening status: FAIL, with 219 of 220 checks passed. The exploratory 17-cell grid differed by 5.748698 K, above the 3 K limit. The selected 33-cell grid differs from the finer 65-cell grid by 1.420734 K. Its separate acceptance was added after the coarse-grid failure; the original result and tolerances are unchanged.

The model accounts for heat spreading, warming, melting and freezing at fixed density. It does not include liquid movement, a container, imperfect thermal contact, radiation, expansion, shrinkage or cycling damage.

Complete saved histories and final fields match across calculations shared by one, two and four graphics processors. Direct exchange between graphics-memory buffers was demonstrated. This campaign makes no universal speed or scaling claim.

Earlier checks of the communication software's memory and programming interface were not clean. The numerical results do not resolve those separate diagnostic issues.

06 / From the presentation

The visual idea.

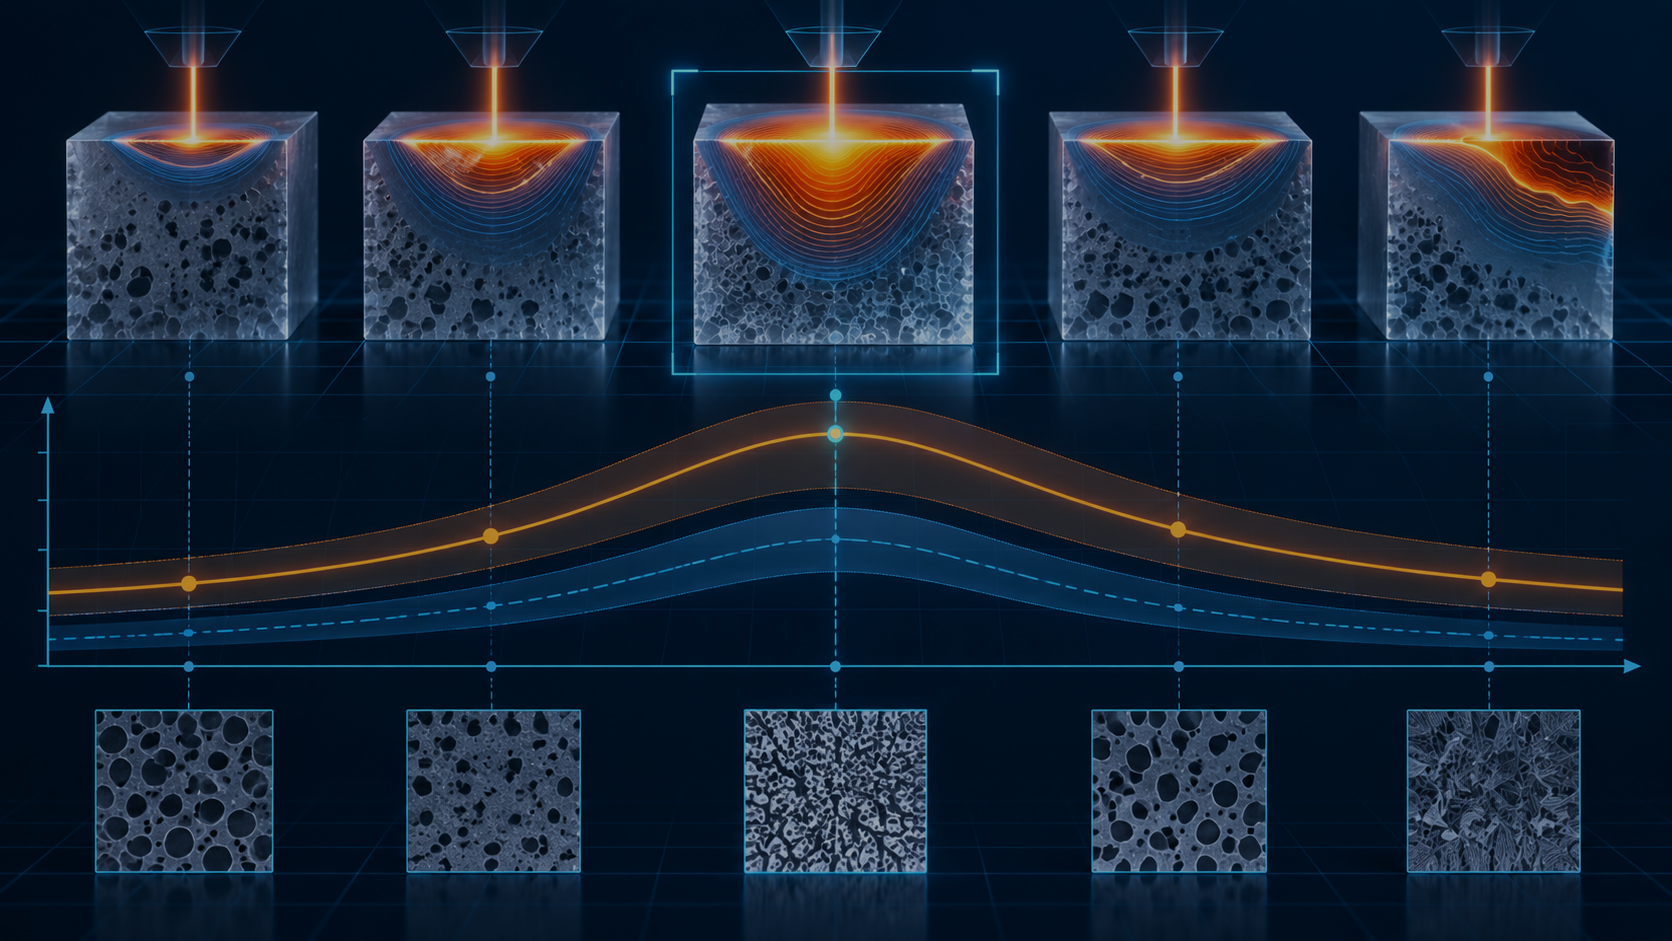
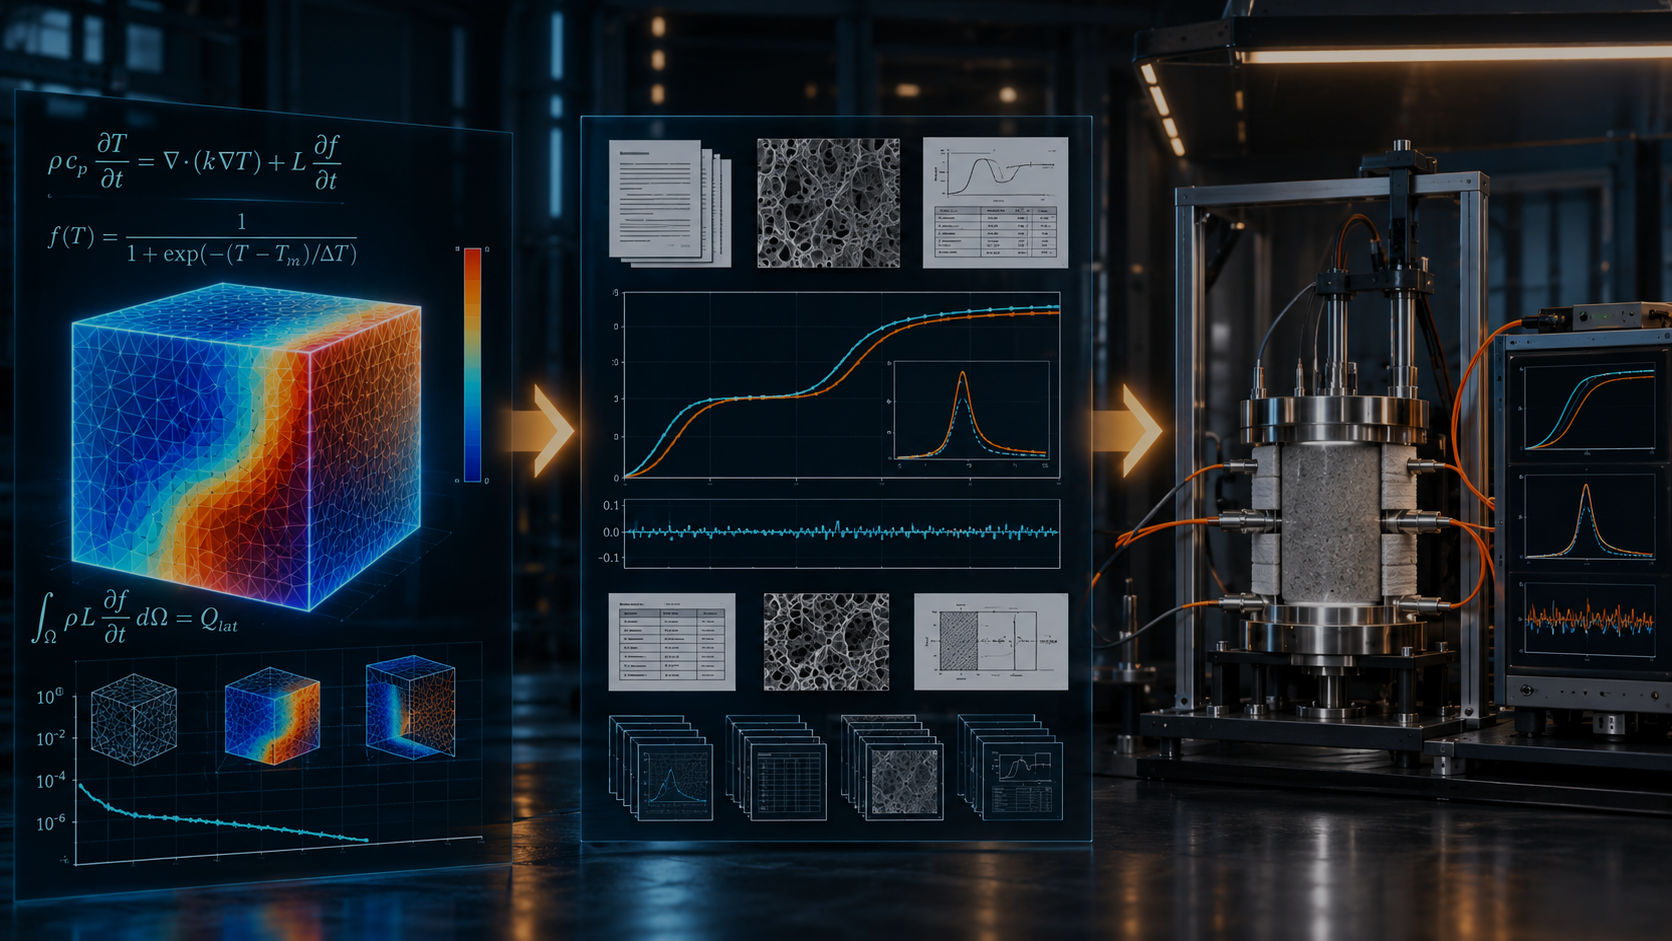
The opening image and these four illustrations come from the supplied PowerPoint. They explain the concept; their shapes, equations and curves are not the numerical evidence. The six result plots above provide that evidence.

Presentation concept illustration of successive solid, melting, liquid and freezing stages.
CONCEPT ILLUSTRATION / SLIDE 2

A cycle of storing and releasing heat

Presentation concept illustration of graphics processors sharing a thermal calculation.
CONCEPT ILLUSTRATION / SLIDE 3

Sharing a calculation

Presentation concept illustration of material variations and illustrative curves.
CONCEPT ILLUSTRATION / SLIDE 4

Exploring material differences

Presentation concept illustration of a future comparison between calculations and laboratory testing.
CONCEPT ILLUSTRATION / SLIDE 5

From calculation to measurement

The porous textures and laboratory setup in the artwork are illustrative. The calculated sample is dense, and independent laboratory validation is a future milestone.

07 / Take the evidence with you

Read. Inspect. Share.

The source documents and numerical table behind this page.

Saved simulation results: 15 September 2026. Figure companion and webpage: 28 September 2026. This page reuses the saved evidence; no new simulation or sample measurement is introduced.

The next milestone

Connect the calculation
to a real sample.

Independent material sample testing is the next step toward material-specific predictions.

Discuss a validation study

Use this on your engineering problem

For material researchers and thermal-storage developers. Tell us about your material, heating cycle, sample measurements and validation needs.

Pricing: quoted per project. Scope, computing needs, validation checks and support determine the quote. Contact us to agree access and deliverables before work starts.

This page presents saved numerical evidence. Independent sample testing is still required for material-specific design decisions.